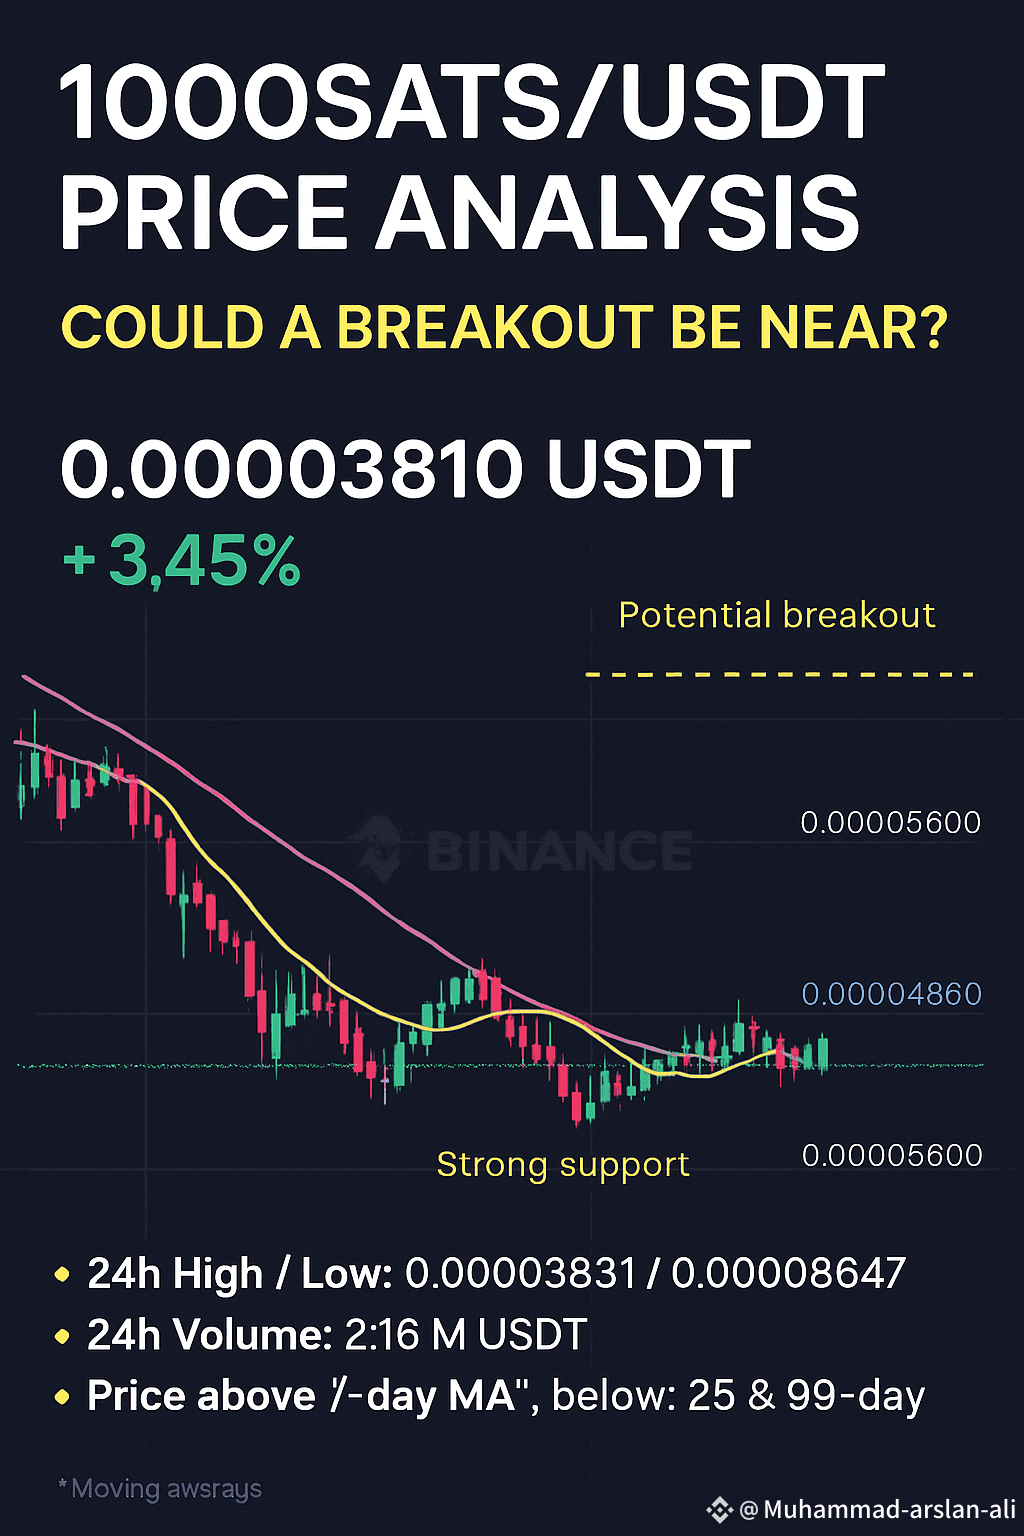
$1000SATS The cryptocurrency 1000SATS/USDT is showing renewed signs of life as it gains +3.45%, trading at 0.00003810 USDT at the time of writing. This slight yet significant move comes amid weeks of consolidation near historical support levels.
📊 Technical Overview:
24h High / Low: 0.00003831 / 0.00003647
Volume: 58.02B (1000SATS), 2.18M (USDT)
Current Price vs MA:
MA(7): 0.00003757
MA(25): 0.00004347
MA(99): 0.00004440
The price is currently trading just above the 7-day moving average and well below the 25-day and 99-day MAs, suggesting that it’s still in a long-term downtrend, but with potential for a short-term bullish reversal.
📊 Technical Snapshot:
24h High / Low: 0.00003831 / 0.00003647
24h Volume: 58.02B (SATS), 2.18M (USDT)
Current Price vs Key Moving Averages:
MA(7): 0.00003757 ✅ (Current price is above — bullish short-term)
MA(25): 0.00004347 ❌ (Still below — resistance ahead)
MA(99): 0.00004440 ❌ (Long-term trend still bearish)
---
🔍 Chart Insights:
The price recently bounced off the 0.00003600 zone, which has acted as strong support.
A small but growing volume spike suggests accumulation may be happening.
If 1000SATS can break above the 0.00004350–0.00004500 range (near MA25 & MA99), a bullish breakout toward 0.00005900 or even 0.00009500 is possible.
However, failure to hold the 0.00003600 level could lead to further downside.
---
📈 Market Outlook:
Today: +0.82%
7 Days: -6.06%
30 Days: +1.11%
90 Days: -11.33%
180 Days: -68.92%
1 Year: -83.19%
These long-term declines highlight just how undervalued the token may currently be — a setup that often precedes explosive moves if sentiment shifts.
---
🧠 Conclusion:
1000SATS is currently trading in a tight range, but technical indicators hint at an upcoming move. With volume starting to increase and the price testing short-term resistance, watch for a breakout above the 25-day MA as a key bullish signal.
⚠️ Not financial advice. dont invest loser coin 🖕🖕🖕🖕❤️🩹❤️🩹