1. ✅ Bullish Marubozu — Buyers in Full Control
🟩 A large green (bullish) candle with little to no wicks. Meaning: Buyers dominated from open to close, signaling strong bullish sentiment.
2. ✅ Hammer — Buyers Reversed the Momentum
🟩 A candle with a long lower wick and small body near the top. Meaning: Sellers pushed the price down, but buyers stepped in strongly and closed the candle higher — a potential bullish reversal.
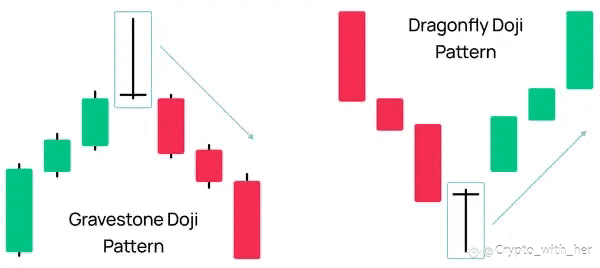
3. ❌ Doji — Market Indecision
🟫 A small-bodied candle with upper and lower wicks. Example: Appears during consolidations, like sideways movement before major news or CPI releases. Meaning: Buyers and sellers balanced each other out, indicating uncertainty.
4. ✅ Inverted Hammer — Sellers Rejected Buyers Late
🟩 A candle with a long upper wick and small body near the bottom. Meaning: Buyers initially took control, but sellers rejected the move and pushed the price down before close. Watch for bearish pressure.
📉 Bottom Row (Left to Right)
5. ✅ Bearish Marubozu — Sellers in Full Control
🟥 A large red (bearish) candle with little to no wicks. Meaning: Sellers controlled the entire session — strong bearish pressure.
6. ✅ Long-Legged Lower Wick — Buyers Fought Back
🟥 A red candle with a long lower wick. Meaning: Sellers drove the price down hard, but buyers managed a decent recovery — could be a sign of support.
7. ❌ Spinning Top — More Indecision
🟧 Small body, both wicks extended. Example: Appears often in sideways markets or during low-volume sessions. Meaning: Neither buyers nor sellers had full control. Often seen before reversals or continuation.
8. ❌ Hanging Man — Buyers Rejected the Sellers
🟥 A red candle with a long lower wick and a small body at the top. Example: Common near local tops. Looks like a hammer but appears after an uptrend. Meaning: Sellers had control early, but buyers pushed it back up. Still, the close was bearish — often a warning of potential reversal.
* ✅ Long Candles = Clear Directional Strength (Bullish or Bearish)
* ❌ Doji / Spinning Tops = Indecision or Consolidation
* ⚡ Wicks = Rejection or Recovery — Look for context (trend direction, volume, support/resistance)
Reading candlesticks is about understanding market psychology. These shapes reveal who's in control, where price was rejected, and where momentum might shift.
#CryptoEducation #cryptlearning #learn2Earn #write2earn #binanceSquare