The price of Sui (SUI) is showing signs of fatigue, trading below the $3.5 mark at the time of writing on Thursday, after losing support from the upward trend line. Negative signals from on-chain data and the derivatives market — such as the Spot Taker CVD index turning negative and the number of short positions surging to the highest level in a month — further complicate the gloomy picture. From a technical perspective, the upward momentum of SUI is gradually weakening, opening up the possibility of a short-term correction.
SUI bears dominate.
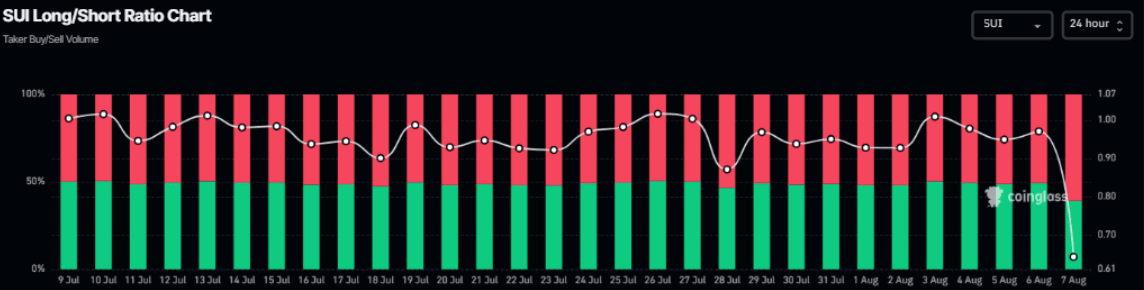
Derivatives data is painting a bleak picture for Sui. As of Thursday, the long/short ratio on CoinGlass is only 0.63 — the lowest in over a month. The fact that this ratio remains below 1 suggests that market sentiment is strongly leaning towards a bearish trend, with the majority of traders betting that the price of SUI will continue to decline.
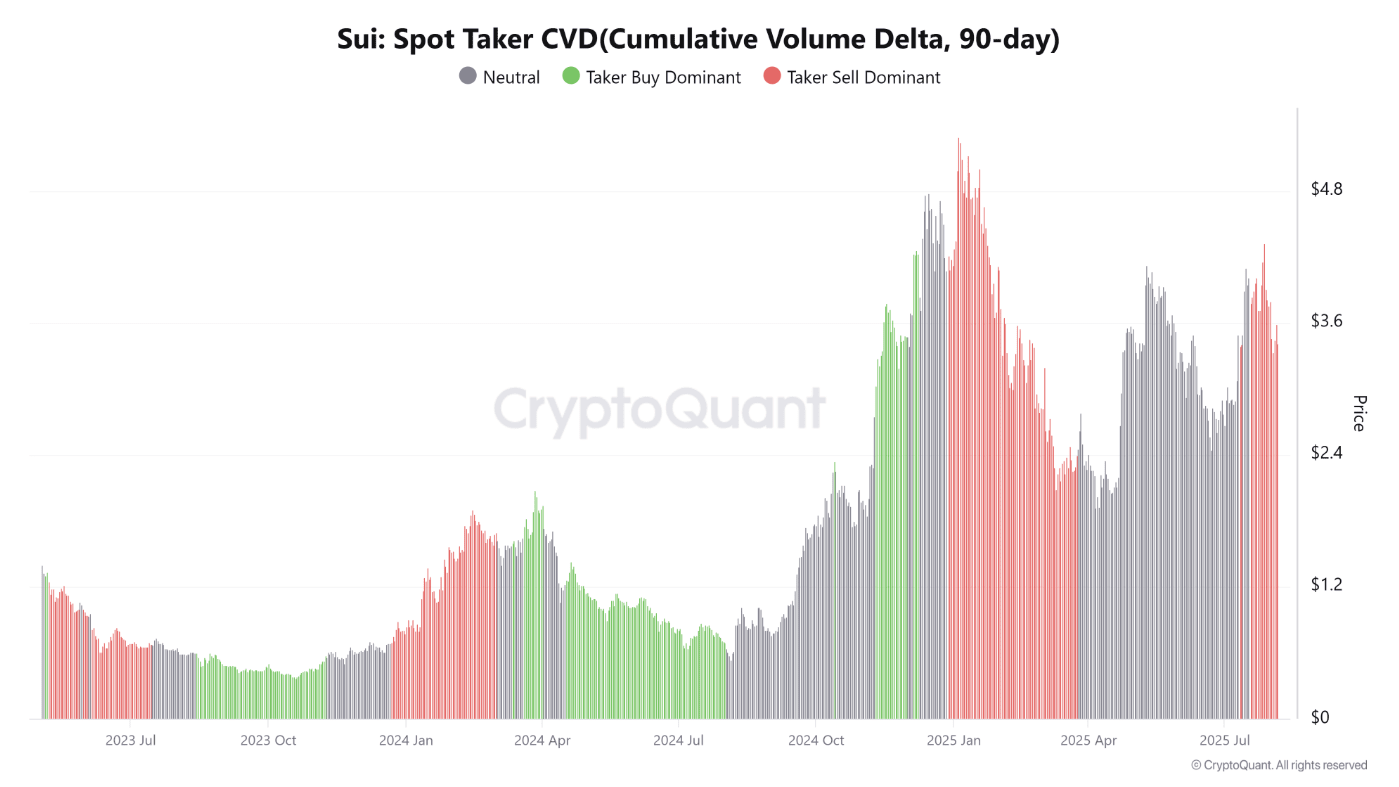
On the on-chain aspect, selling pressure on SUI is also continuously increasing. The Spot Taker CVD (Cumulative Volume Delta) index provided by CryptoQuant is currently in negative territory and has been continuously declining since mid-July.
This index tracks the accumulation difference between buying and selling volume at market prices over the last three months. If the three-month CVD has a positive value and is increasing, it indicates a dominant buying phase (Taker Buy Dominant Phase). Conversely, when the index turns negative and continues to decline — as it is now — it reflects that the market is entering a dominant selling phase (Taker Sell Dominant Phase).
Price forecast for Sui: Momentum indicators indicate weakness.
The price of Sui (SUI) lost its upward momentum last Friday, closing below the upward trend line — established by connecting the lows since June 22. The weakness continued to spread as the price dropped nearly 4% in the next session. However, the selling pressure temporarily eased as SUI bounced back from the important support area around the 200-day exponential moving average (EMA) at $3.35 on Sunday. Subsequently, this altcoin quickly returned to test the trend line it just broke on the following day.
Currently, this trend line coincides with the daily resistance zone at $3.65 and the 61.8% Fibonacci retracement level at $3.62 — forming a critical resistance area. In Tuesday's session, SUI failed to break through this zone and continued to retreat. Nevertheless, the bulls still showed defensive efforts around the 200-day EMA on the following session. As of the time of writing (Thursday), SUI is fluctuating around the $3.50 mark.
If SUI loses the support level of the 200-day EMA at $3.35 on the daily timeframe, the correction may continue towards the next support zone at $2.90.
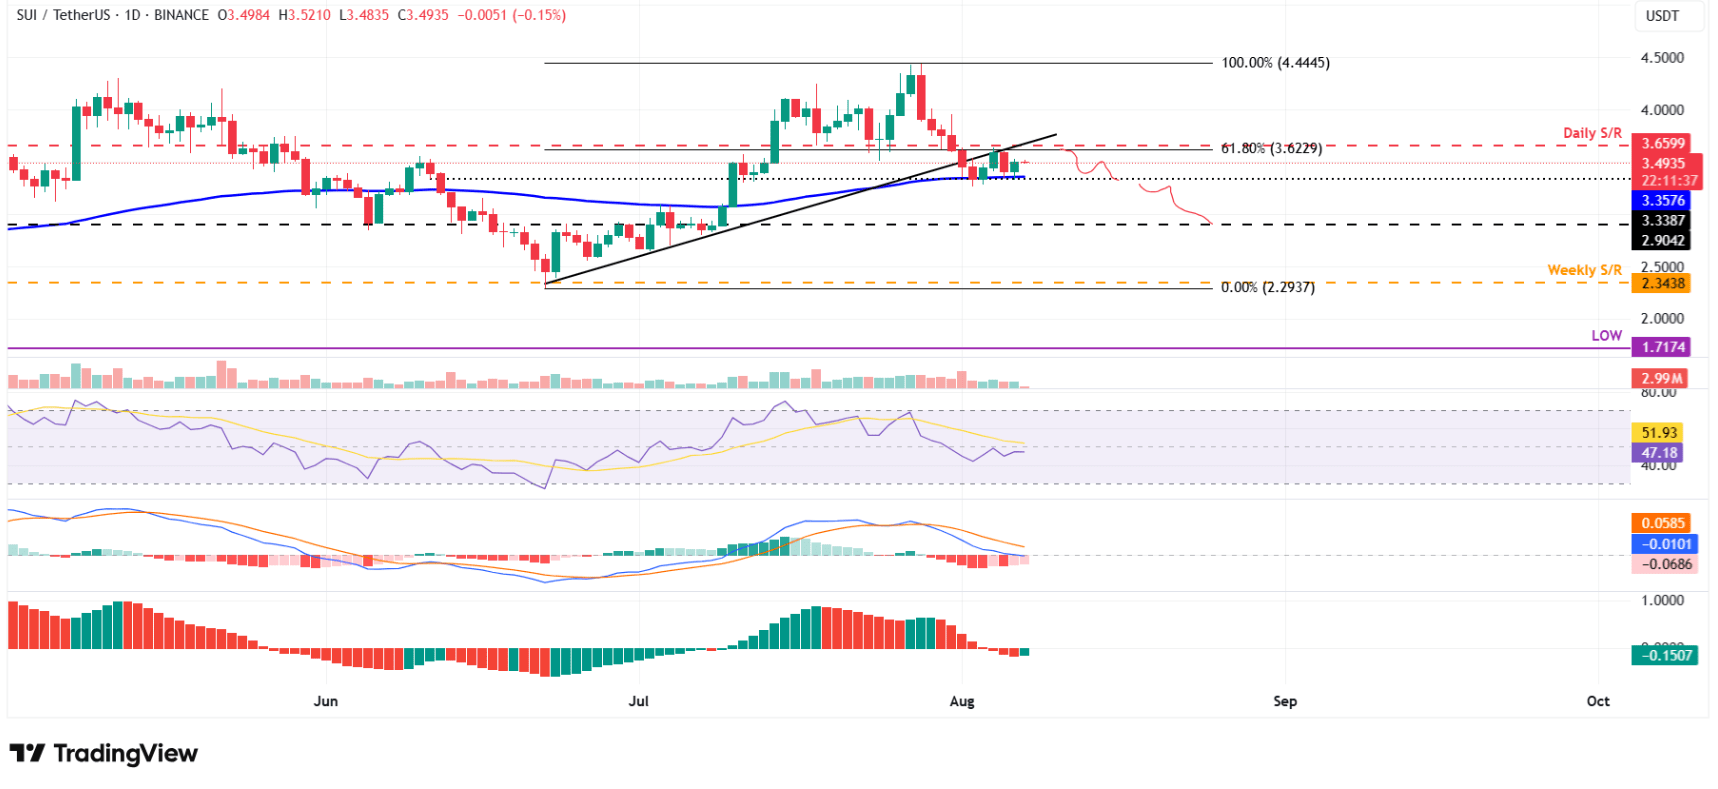
Regarding technical indicators, both the relative strength index (RSI) and the Awesome Oscillator (AO) are currently below the neutral threshold — at 50 and 0, respectively — reflecting a trend skewed towards the sellers. Additionally, the bearish crossover signal on the MACD that appeared on July 29 is still in effect, indicating that selling pressure remains dominant.
However, if SUI can conquer the resistance level of $3.65 and close above this level on the daily timeframe, a bullish outlook could be triggered, opening up the opportunity to return to the peak of $4.44 reached on July 28.