After rising over 20% within a week, PUMP has yet to show signs of cooling off. Although the increase in the last 24 hours was only 2.3%, this token continues to demonstrate superior strength, especially in the context of much of the market showing signs of stagnation.
This raises an important question: Is a new breakout being nurtured or are these the final swings of the current bullish trend?
Let's delve into the on-chain data, potential liquidation clusters, and chart patterns to identify clues that may reveal PUMP's next direction.
Whales and KOLs continue to actively accumulate PUMP
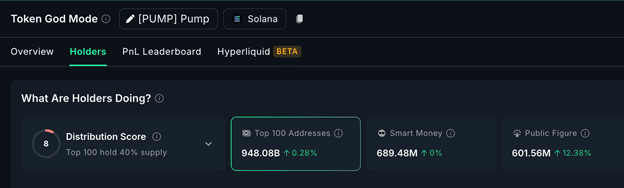
While the price of PUMP is in an accumulation phase just below the important resistance of $0.0035, the behavior of large wallets and influential figures in the crypto space shows a completely different picture: they are continuously buying in.
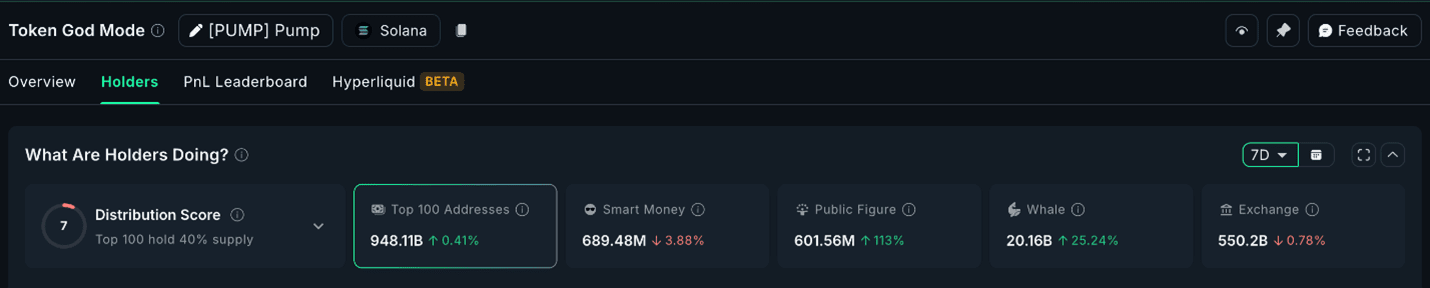
According to data from Nansen, the top 100 largest wallet addresses currently hold 948.08 billion PUMP, increasing by 0.28% just in the past 24 hours. More notably, public wallets—often associated with veteran traders, KOLs, and well-known founders in the market—have increased their holdings by 12.38%, owning a total of 601.56 million tokens.
This is a sign that cannot be overlooked: those who understand the game appear to be betting that this bullish rally is far from over.
What’s particularly noteworthy is that whales have been quietly accumulating throughout the past week. In the last 7 days, whale holdings have increased by 25.24%. This is not a sign of exhaustion but rather an expression of strong confidence.
These large players are buying in while prices are strong, indicating that they still see room for growth in the near future.
Supporting this viewpoint is the derivatives market. The Long/Short ratio has shifted to a distinctly bullish trend over the past few days, remaining above 1.05.
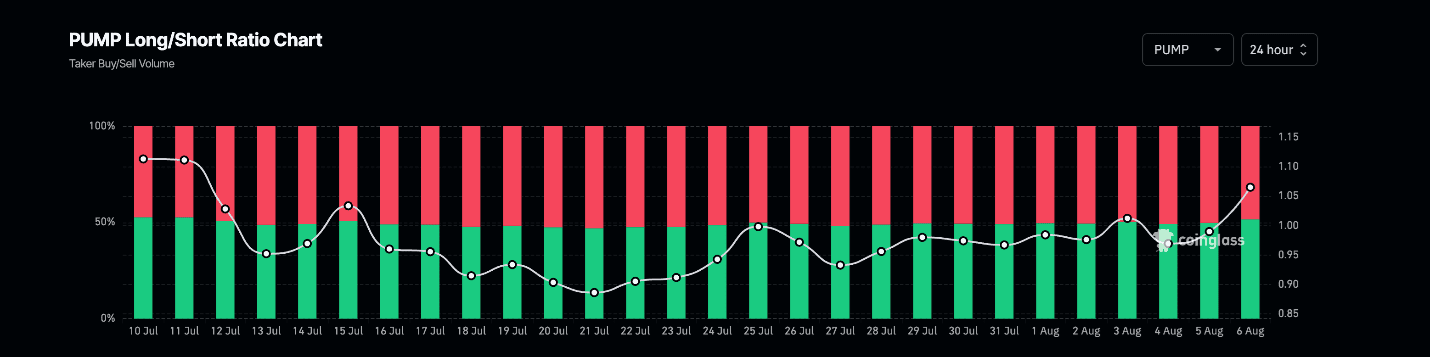
This means that more and more traders are opening Long positions rather than Short. At the same time, the increasing leverage trend is in agreement with the on-chain smart money activity.
The liquidation map shows where Short positions could be 'wiped out'
The liquidation map from Hyperliquid also supports the bullish outlook. With the current price at $0.0034, PUMP is approaching a dense cluster of Short positions.
The largest Short liquidation cluster starts from $0.0035 and is denser in the range from $0.0035 to $0.0039—this is the area where Short orders are at risk of being 'swept away'.
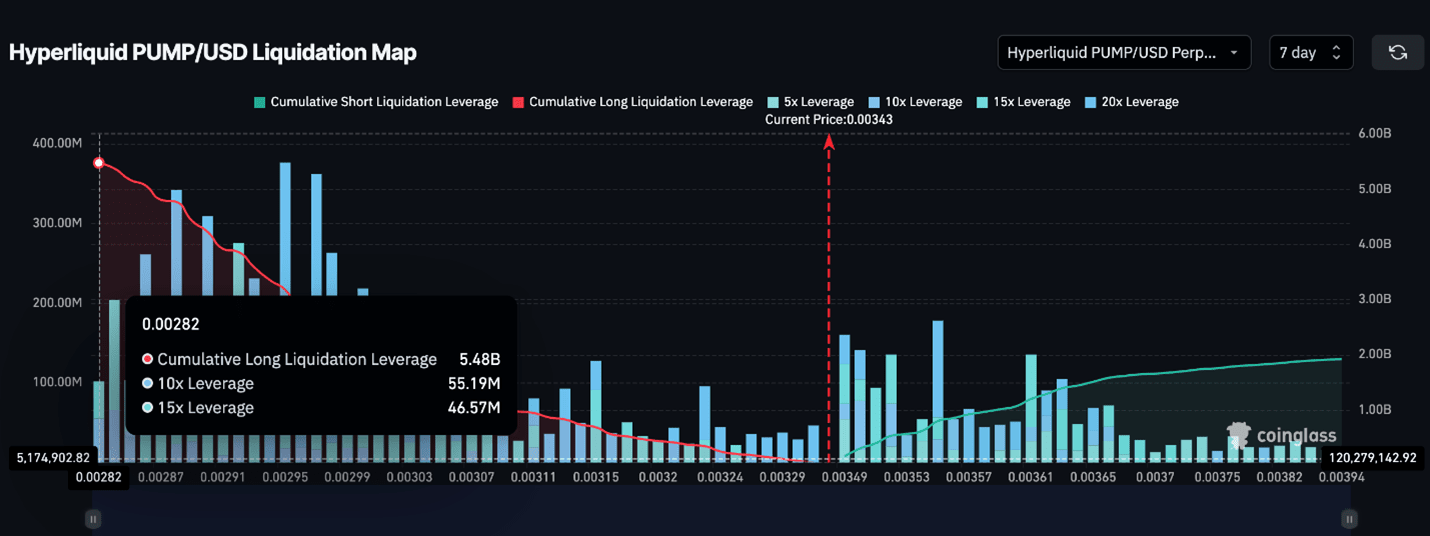
Although the total Short OI is valued at about $1.92 billion, Long positions currently amount to $5.48 billion—almost three times as much. Despite the smaller number of Short orders, their massive size makes these positions vulnerable. If PUMP surpasses the $0.0035 mark, it could trigger a liquidation chain reaction, forcing Short orders to close, thereby pushing the price up even further.
These liquidation levels are not just numbers. They are 'pressure points' in the market and almost perfectly align with the price action pattern forming on the chart.
PUMP aims for a breakout from the ascending triangle pattern
On the 2-hour timeframe, PUMP is trading within an ascending triangle pattern. This setup typically ends with a bullish breakout, especially when supported by higher lows and accumulation activity—exactly what we are seeing at present.
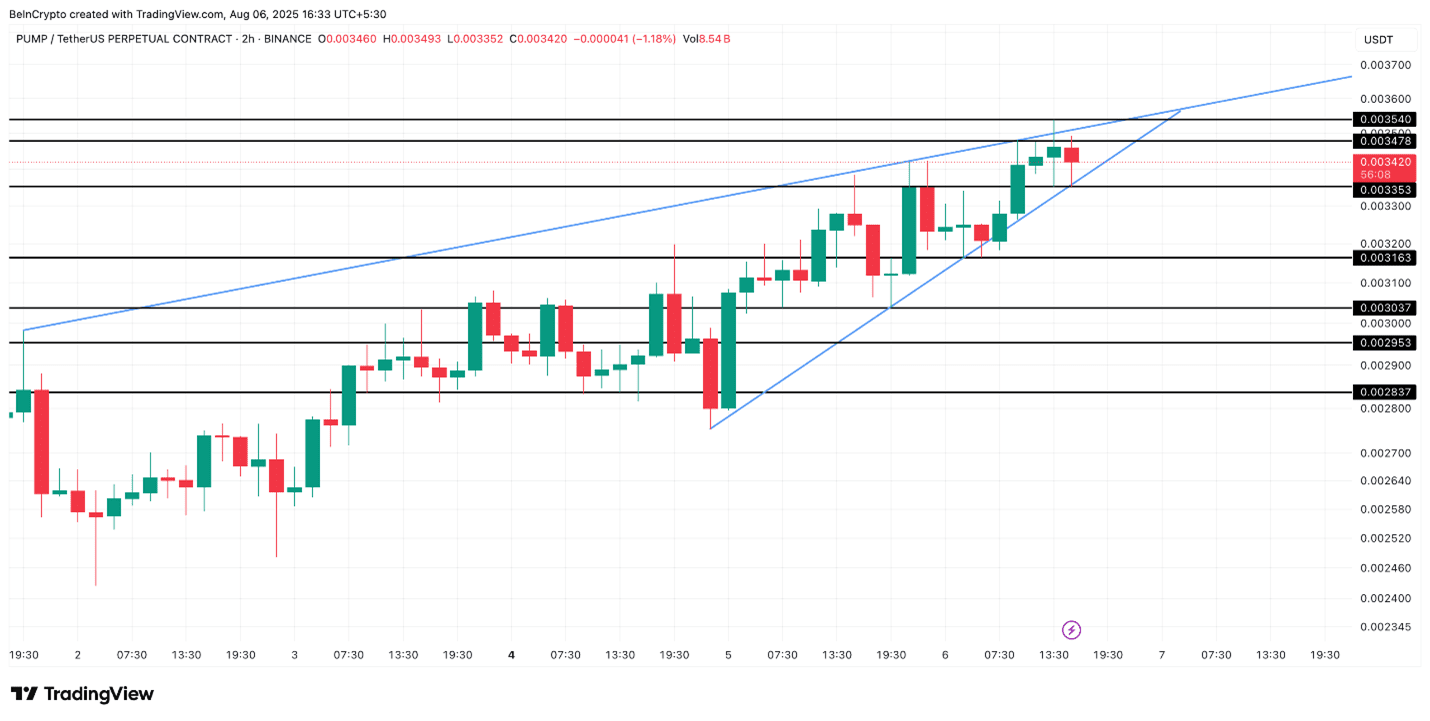
Note that there have been two drops through the lower trendline, but both were just wick candles, not full candles closing below. According to standard technical analysis principles, a valid breakout from an ascending triangle pattern typically requires clear full candle closes below the trendline, accompanied by confirming volume. Since this has not happened, the ascending triangle pattern is still considered valid.
The important resistance level that needs to be surpassed is around $0.0035—where there was previously an attempted breakout. This price level also coincides with the liquidation cluster we just mentioned, creating a 'double activation point' for bullish momentum.
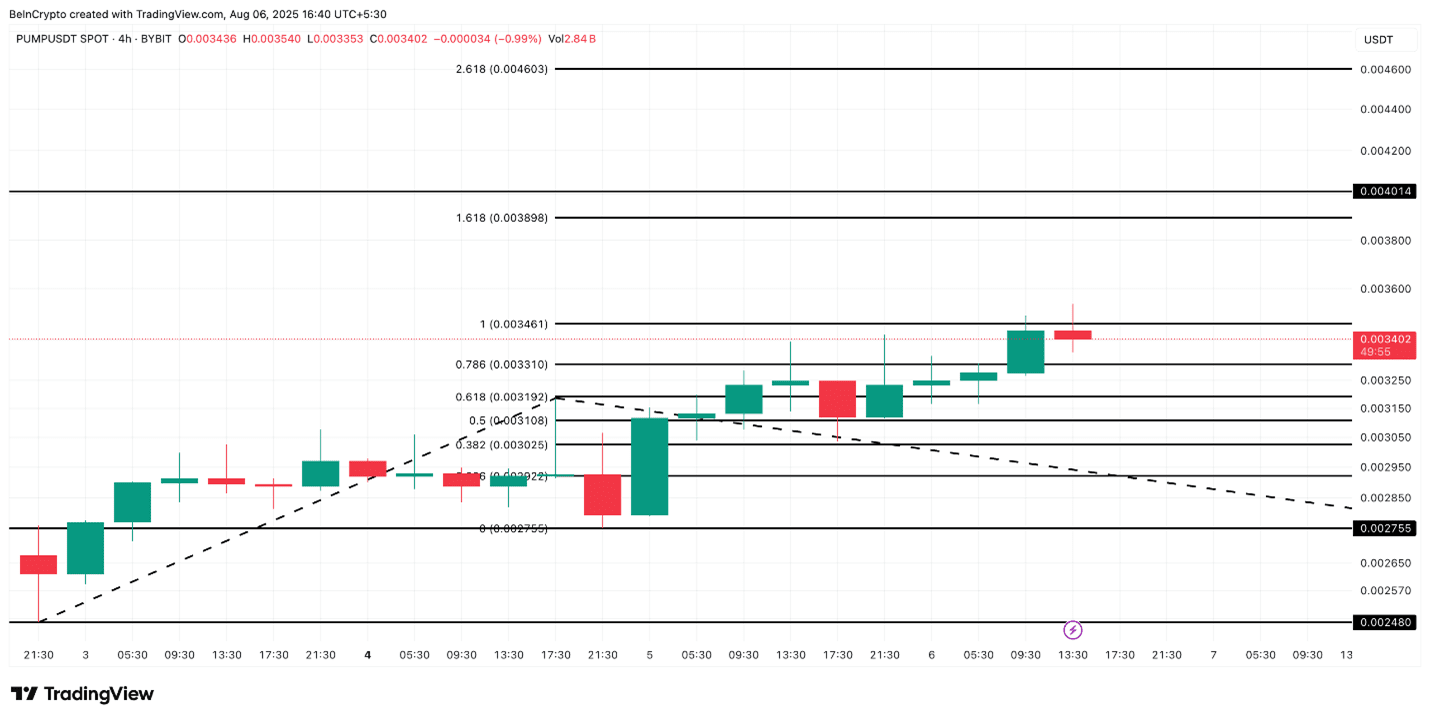
If this resistance level is broken, the next closest resistance will be at $0.0038, followed by $0.004. The $0.0038 level corresponds to a 15% increase from the current price of $0.0034. This is also an important Fibonacci extension area and a significant psychological round number, often acting as a 'resistance magnet'. If the upward momentum continues past $0.004, the next target will be around $0.0046—corresponding to an increase of about 35% from the current level.
However, traders also need to monitor the possibility of negation. If PUMP fails to maintain support at the ascending trendline around $0.0033 and breaks below it, the current bullish structure will be invalidated. This could open up the possibility of a deeper correction towards the $0.003 area or even lower.