In today’s crypto market, smart traders know that patterns don’t lie — they whisper profit. And right now, $RPL
RPL/USDT is whispering LOUD.
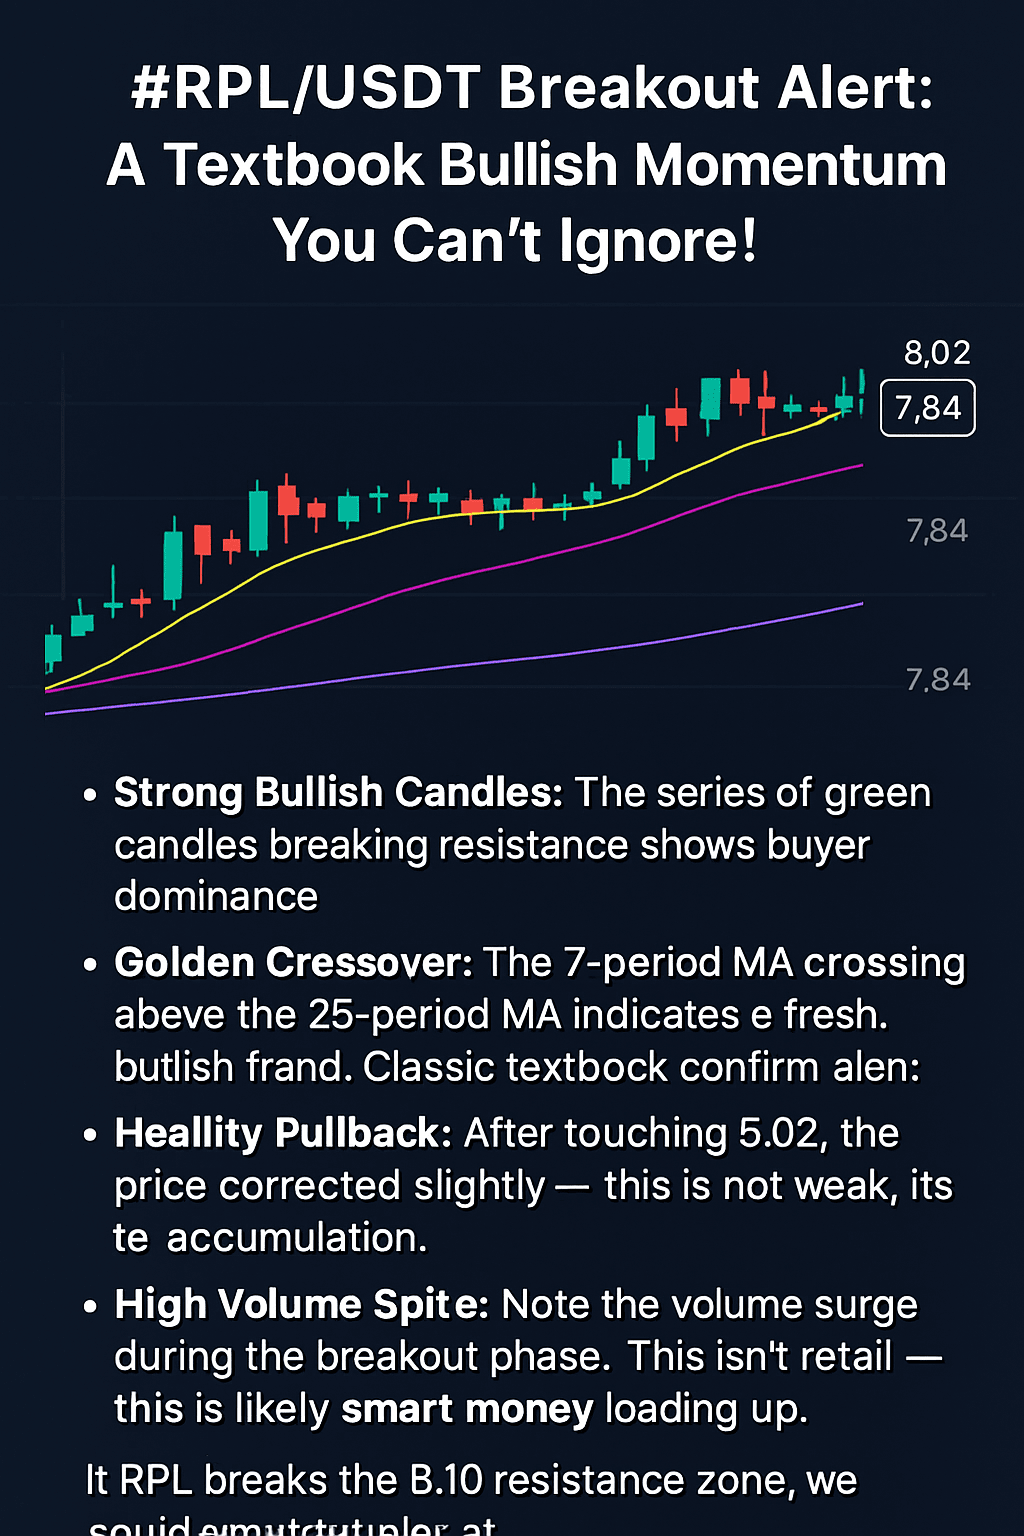
On the 15-minute chart, $RPL has painted a classic bullish continuation pattern, climbing from a low of 6.57 to a current high of 8.02, before stabilizing near 7.94. But what makes this chart so powerful?
🔍 Chart Highlights:
Strong Bullish Candles: The series of green candles breaking resistance shows buyer dominance.
Golden Crossover: The 7-period MA crossing above the 25-period MA indicates a fresh bullish trend. Classic textbook confirmation!
Healthy Pullback: After touching 8.02, the price corrected slightly — this is not weakness, it's re-accumulation.
High Volume Spike: Note the volume surge during the breakout phase. This isn’t retail — this is likely smart money loading up.
This isn’t just any random pump. This chart tells a story of strength, a well-timed breakout, and possibly another leg up coming soon. If RPL breaks the 8.10 resistance zone, we could see fireworks.
🔥 Why This Setup Matters?
Many traders wait for confirmation — and this chart gives multiple: ✅ Breakout with volume
✅ MA crossover support
✅ Psychological resistance at 8 being tested again
✅ RSI cooling off without major dump
In short, this chart is the calm before the next bullish storm.
📣 Final Thoughts:
If you're a scalper, swing trader, or breakout hunter, this is the kind of chart that gets screenshotted, shared, and remembered. Don’t just trade blindly — learn to read the signals. And this one’s shouting: $RPL wants to fly. Are you ready?
#cryptouniverseofficial #TradingSignals
#TechnicalAnalysis ptoGains
