The crypto market never sleeps, and today the spotlight is on $PROVE
PROVE/USDT, which skyrocketed +194% in an explosive bullish move, leaving traders both stunned and excited.
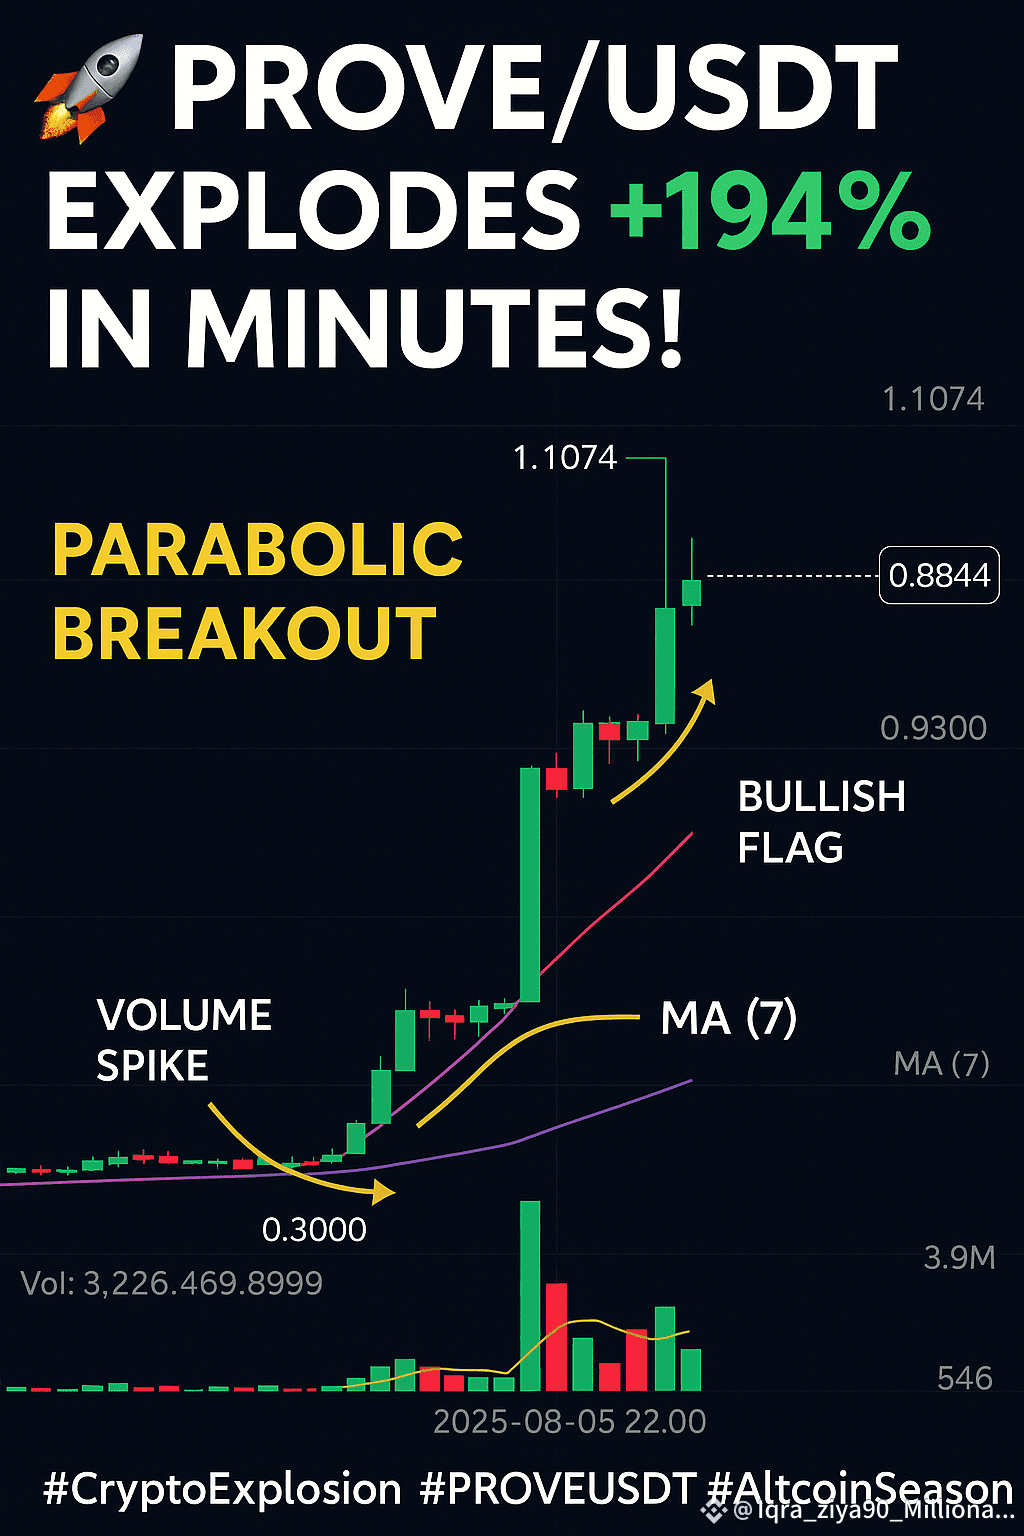
On the 15-minute timeframe, we witnessed a classic parabolic breakout. The price jumped from a low of $0.3000 to an intraday high of $1.1074, forming a massive green candle that signals extreme buying pressure and possibly whale entry.
🔍 What Makes This Chart Pattern So Powerful?
✅ Bullish Momentum Build-Up:
After the giant candle, the price didn’t collapse—instead, it formed smaller green candles with higher lows, indicating sustained buying.
✅ Volume Confirmation:
As price surged, volume bars also spiked, confirming the move is organic, not manipulation. Smart money may be accumulating.
✅ Healthy Flag Formation:
After the first pump, a bullish flag pattern appeared, often seen before the next continuation leg up.
✅ MA(7) Curving Upward:
The 7-period moving average is sharply rising, hugging the candles and providing support, a textbook bullish indicator.
🧠 What Traders Should Watch:
🔹 A break above $1.1074 could trigger another powerful rally.
🔹 If the price holds above $0.7925, bulls stay in control.
🔹 Watch for a pullback to MA(7)—it might be a buy-the-dip opportunity.
This is the kind of chart that short-term scalpers, momentum traders, and even swing traders dream about.
📈 Why This Chart Could Go Viral?
The $PROVE /USDT chart is not just data—it's a story of breakout, momentum, and fear of missing out (FOMO). It embodies everything that crypto traders love: fast gains, clear patterns, and bullish continuation.
If you're not watching $PROVE /USDT, you might be missing the next breakout legend.
#crypto #prove #altcoinseason #Binance #candlestick_patterns
