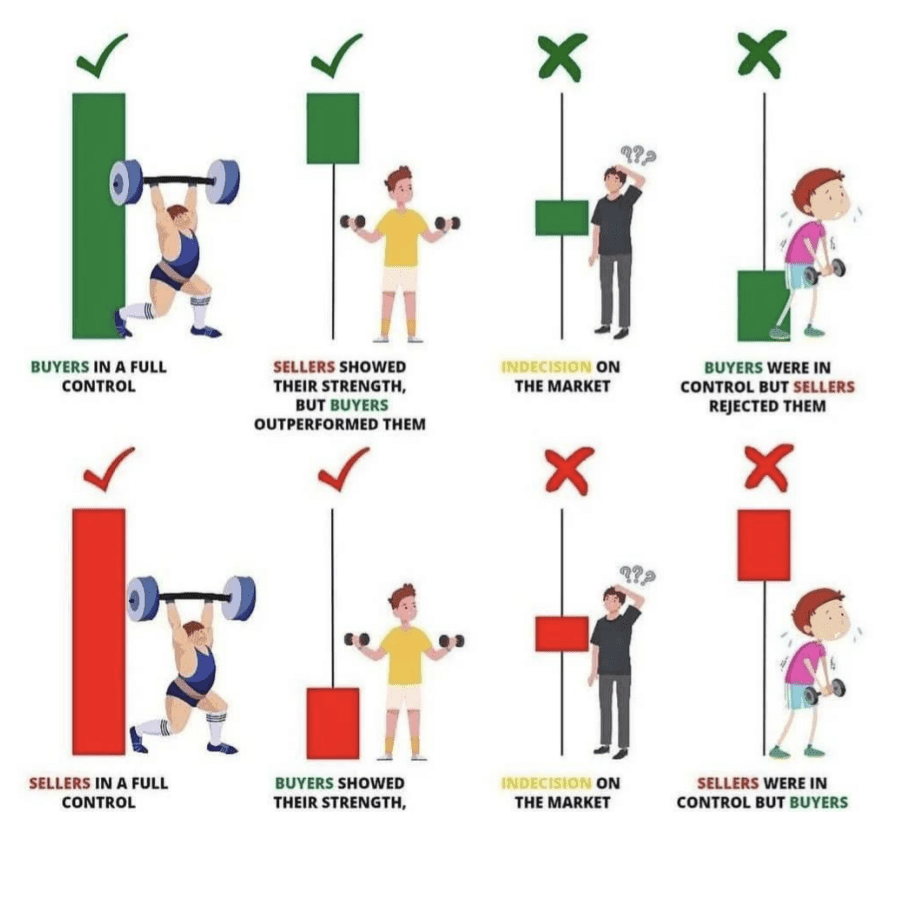
🔹 Top row (from left to right):
1. ✅ Buyers in complete control
🟩 Large green candle - Strong bullish momentum, buyers dominated the session.
2. ✅ Sellers showed strength, but buyers prevailed
🟩 Long lower wick - Sellers pushed the price down but buyers recovered and closed at a higher level.
3. ❌ Indecision in the market
🟫 Doji candle - Equal pressure from buyers and sellers, indicating uncertainty in the market.
4. ✅ Buyers were in control but sellers rejected them
🟩 Long upper wick - Buyers pushed the price up, but sellers forced the price to close at a lower level.
---
🔹 Bottom row (from left to right):
5. ✅ Sellers in complete control
🟥 Large red candle - Strong bearish momentum, sellers dominated the session.
6. ✅ Buyers showed their strength
🟥 Long lower wick - Buyers tried to fight back after sellers pushed the price down.
7. ❌ Indecision in the market
🟧 Small body candle with wicks - Uncertainty; no clear winner between buyers or sellers.
8. ❌ Sellers were in control but buyers rejected them
🟥 Long lower wick - Sellers pushed the price down but buyers regained ground before the close.
---
💡 Summary:
✔️ Long candles = clear strength
❌ Doji = indecision
✔️ Wicks = rejection or recovery
This chart helps you read the sentiment behind the candles 🧠🔥
And here is the candle picture 👇
@BounceBit @612 Ceros @Vlad of Guessko @NJOOD93 @sam3_Zilzal @Fouz-DZ-16 @RUOA ALI
#تدريب_المبتدائين #تدوال_في_بينانس #تعليم_التداول #BinanceSquareFamily #crypto