🚨 Learn these candles and you will not face any losses in cryptocurrencies ☑️👇
🔹 Top row (from left to right):
1. ✅Buyers are in complete control.
🟩 Large green candle - strong bullish momentum, buyers dominated the session.
2. ✅ Sellers showed strength, but buyers outperformed.
🟩 Long Lower Wick - Sellers pushed the price lower but buyers recovered and closed at a higher level.
3. ❌ Frequency in the market
🟫 Doji candle - equal pressure from buyers and sellers, indicating uncertainty in the market.
4. ✅ Buyers were in control but sellers rejected them.
🟩 Long upper wick - Buyers pushed the price higher, but sellers forced the price to close at a lower level.
---
🔹 Bottom row (from left to right):
5. ✅ Sellers are in complete control.
🟥 Large red candle - strong bearish momentum, sellers dominated the session.
6. ✅ Buyers showed their strength
🟥 Long lower wick - Buyers tried to fight back after sellers pushed the price lower.
7. ❌ Frequency in the market
🟧 Small body candle with wicks - uncertainty; no clear winner among buyers or sellers.
8. ❌ The sellers were in control but the buyers rejected them.
🟥 Long Low Wick - Sellers pushed the price lower but buyers regained ground before the close.
---
💡 Summary:
✔️ Long candles = clear strength
❌ Doji = frequency
✔️ Wicks = rejection or recovery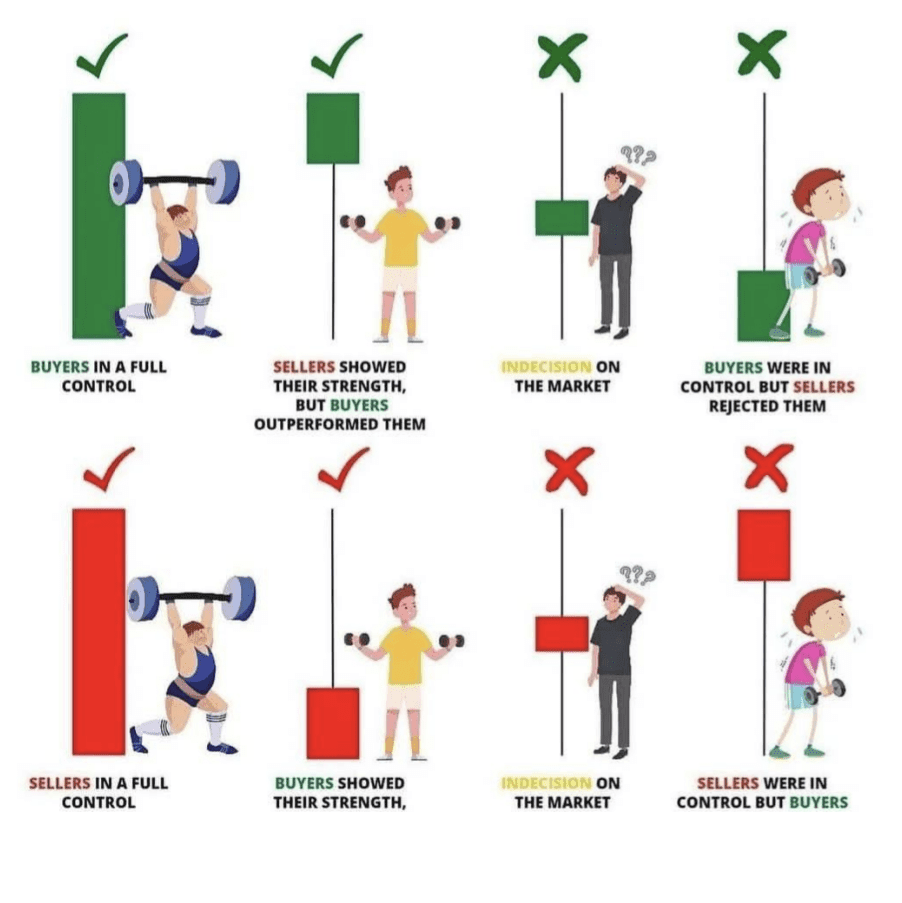
This chart helps you read the emotions behind the candles 🧠🔥
Here is a picture of the candles 👇
If you find the post helpful, please follow, like and comment, thank you 👍
#notcoin#BuiltonSolayer#IPOWave #BTCUnbound
