Price is under all key moving averages and pivotal resistance levels.
Daily RSI is at 36.70 and trending down, not yet extremely oversold, so more downside is possible.
MACD and momentum indicators confirm negative trend.
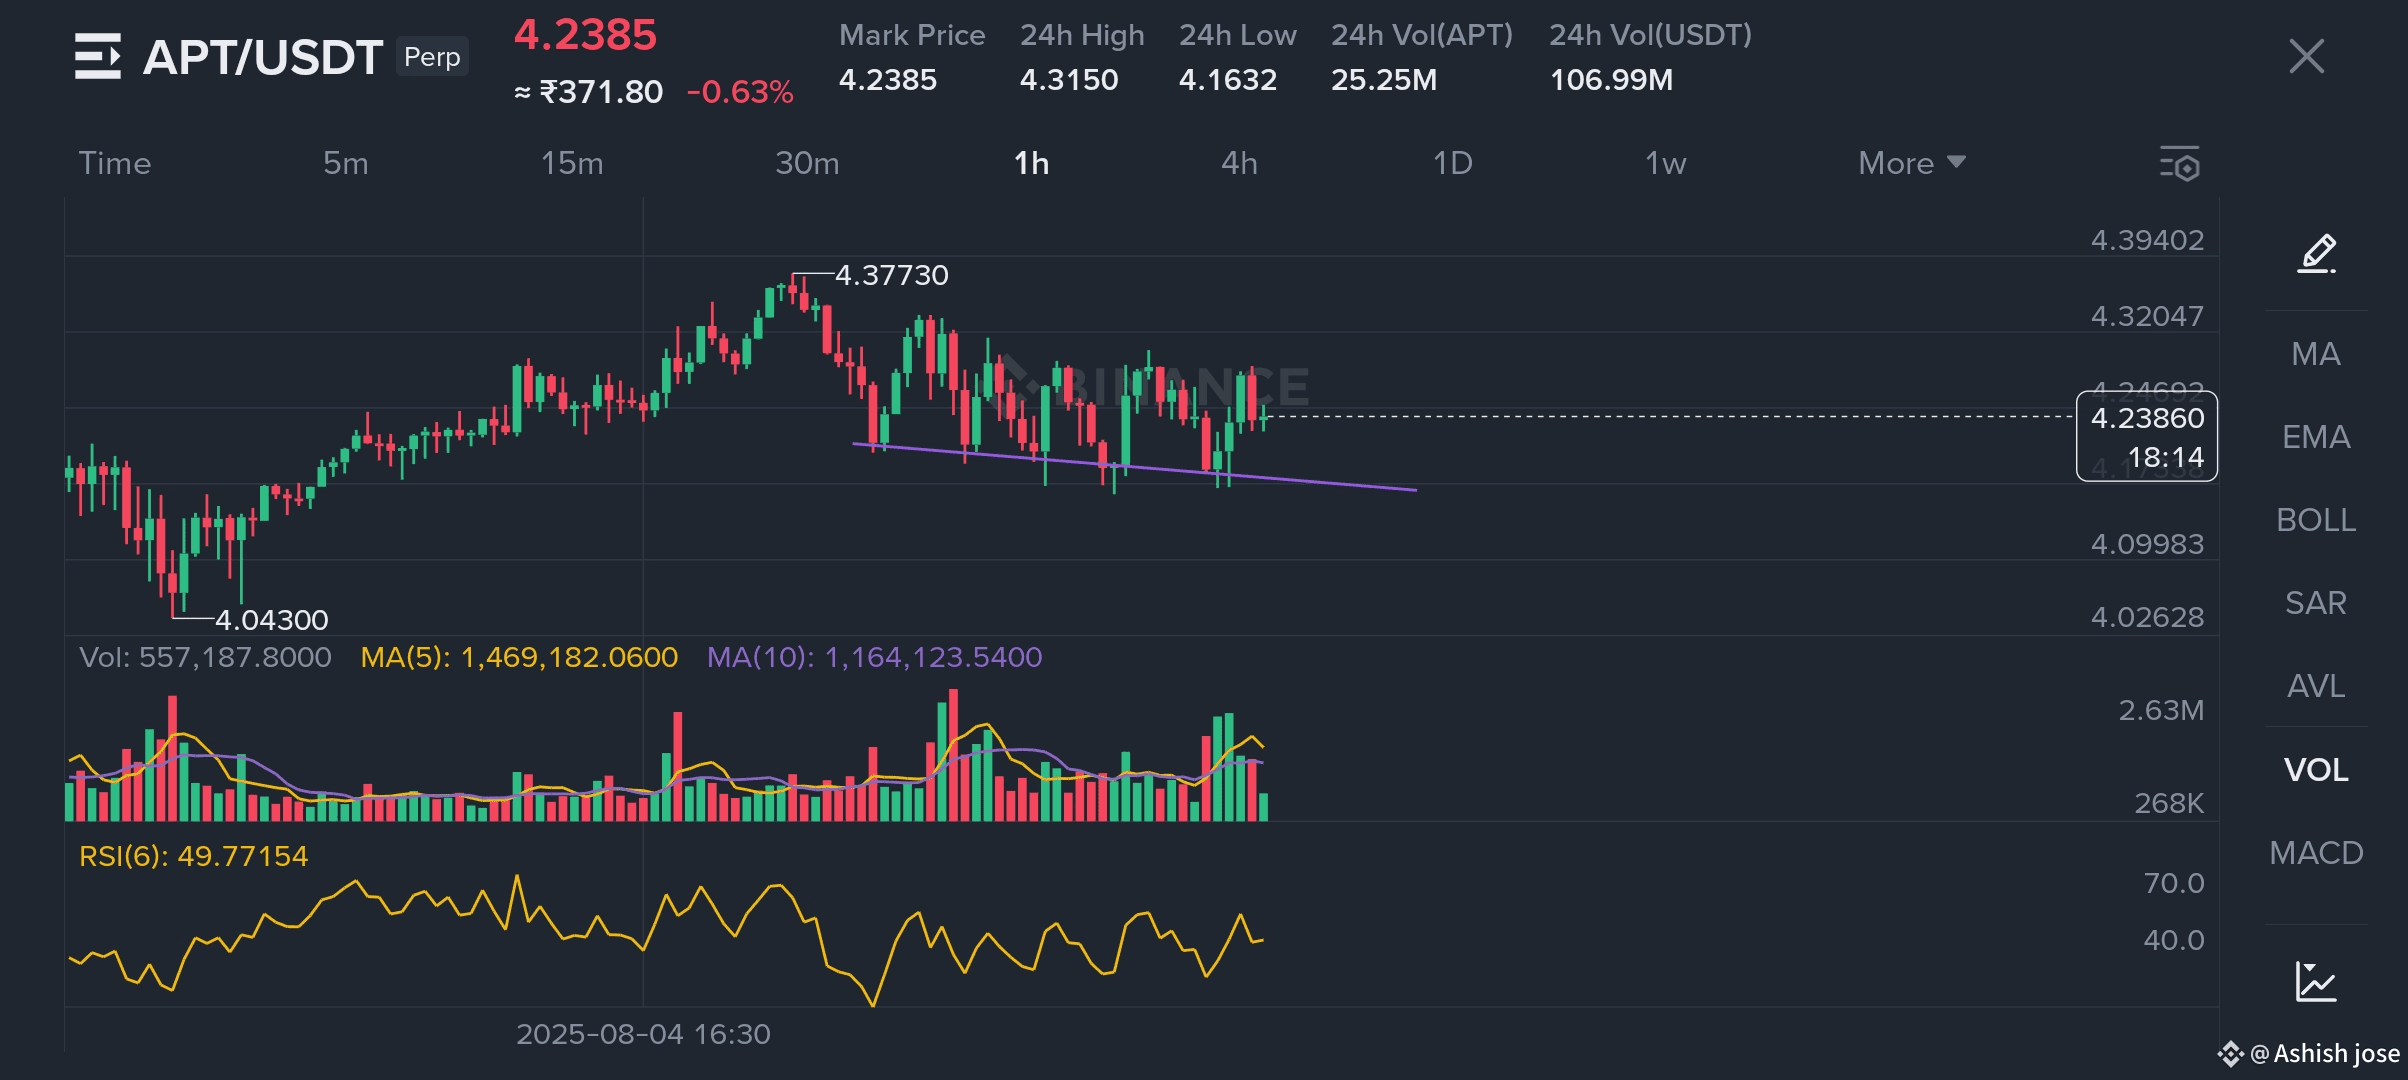
1-Hour (1H) Timeframe
Trend: Strongly bearish.
Moving Averages: Approximately 93% of moving averages indicate a bearish trend. Short-term moving averages particularly support this negative outlook.
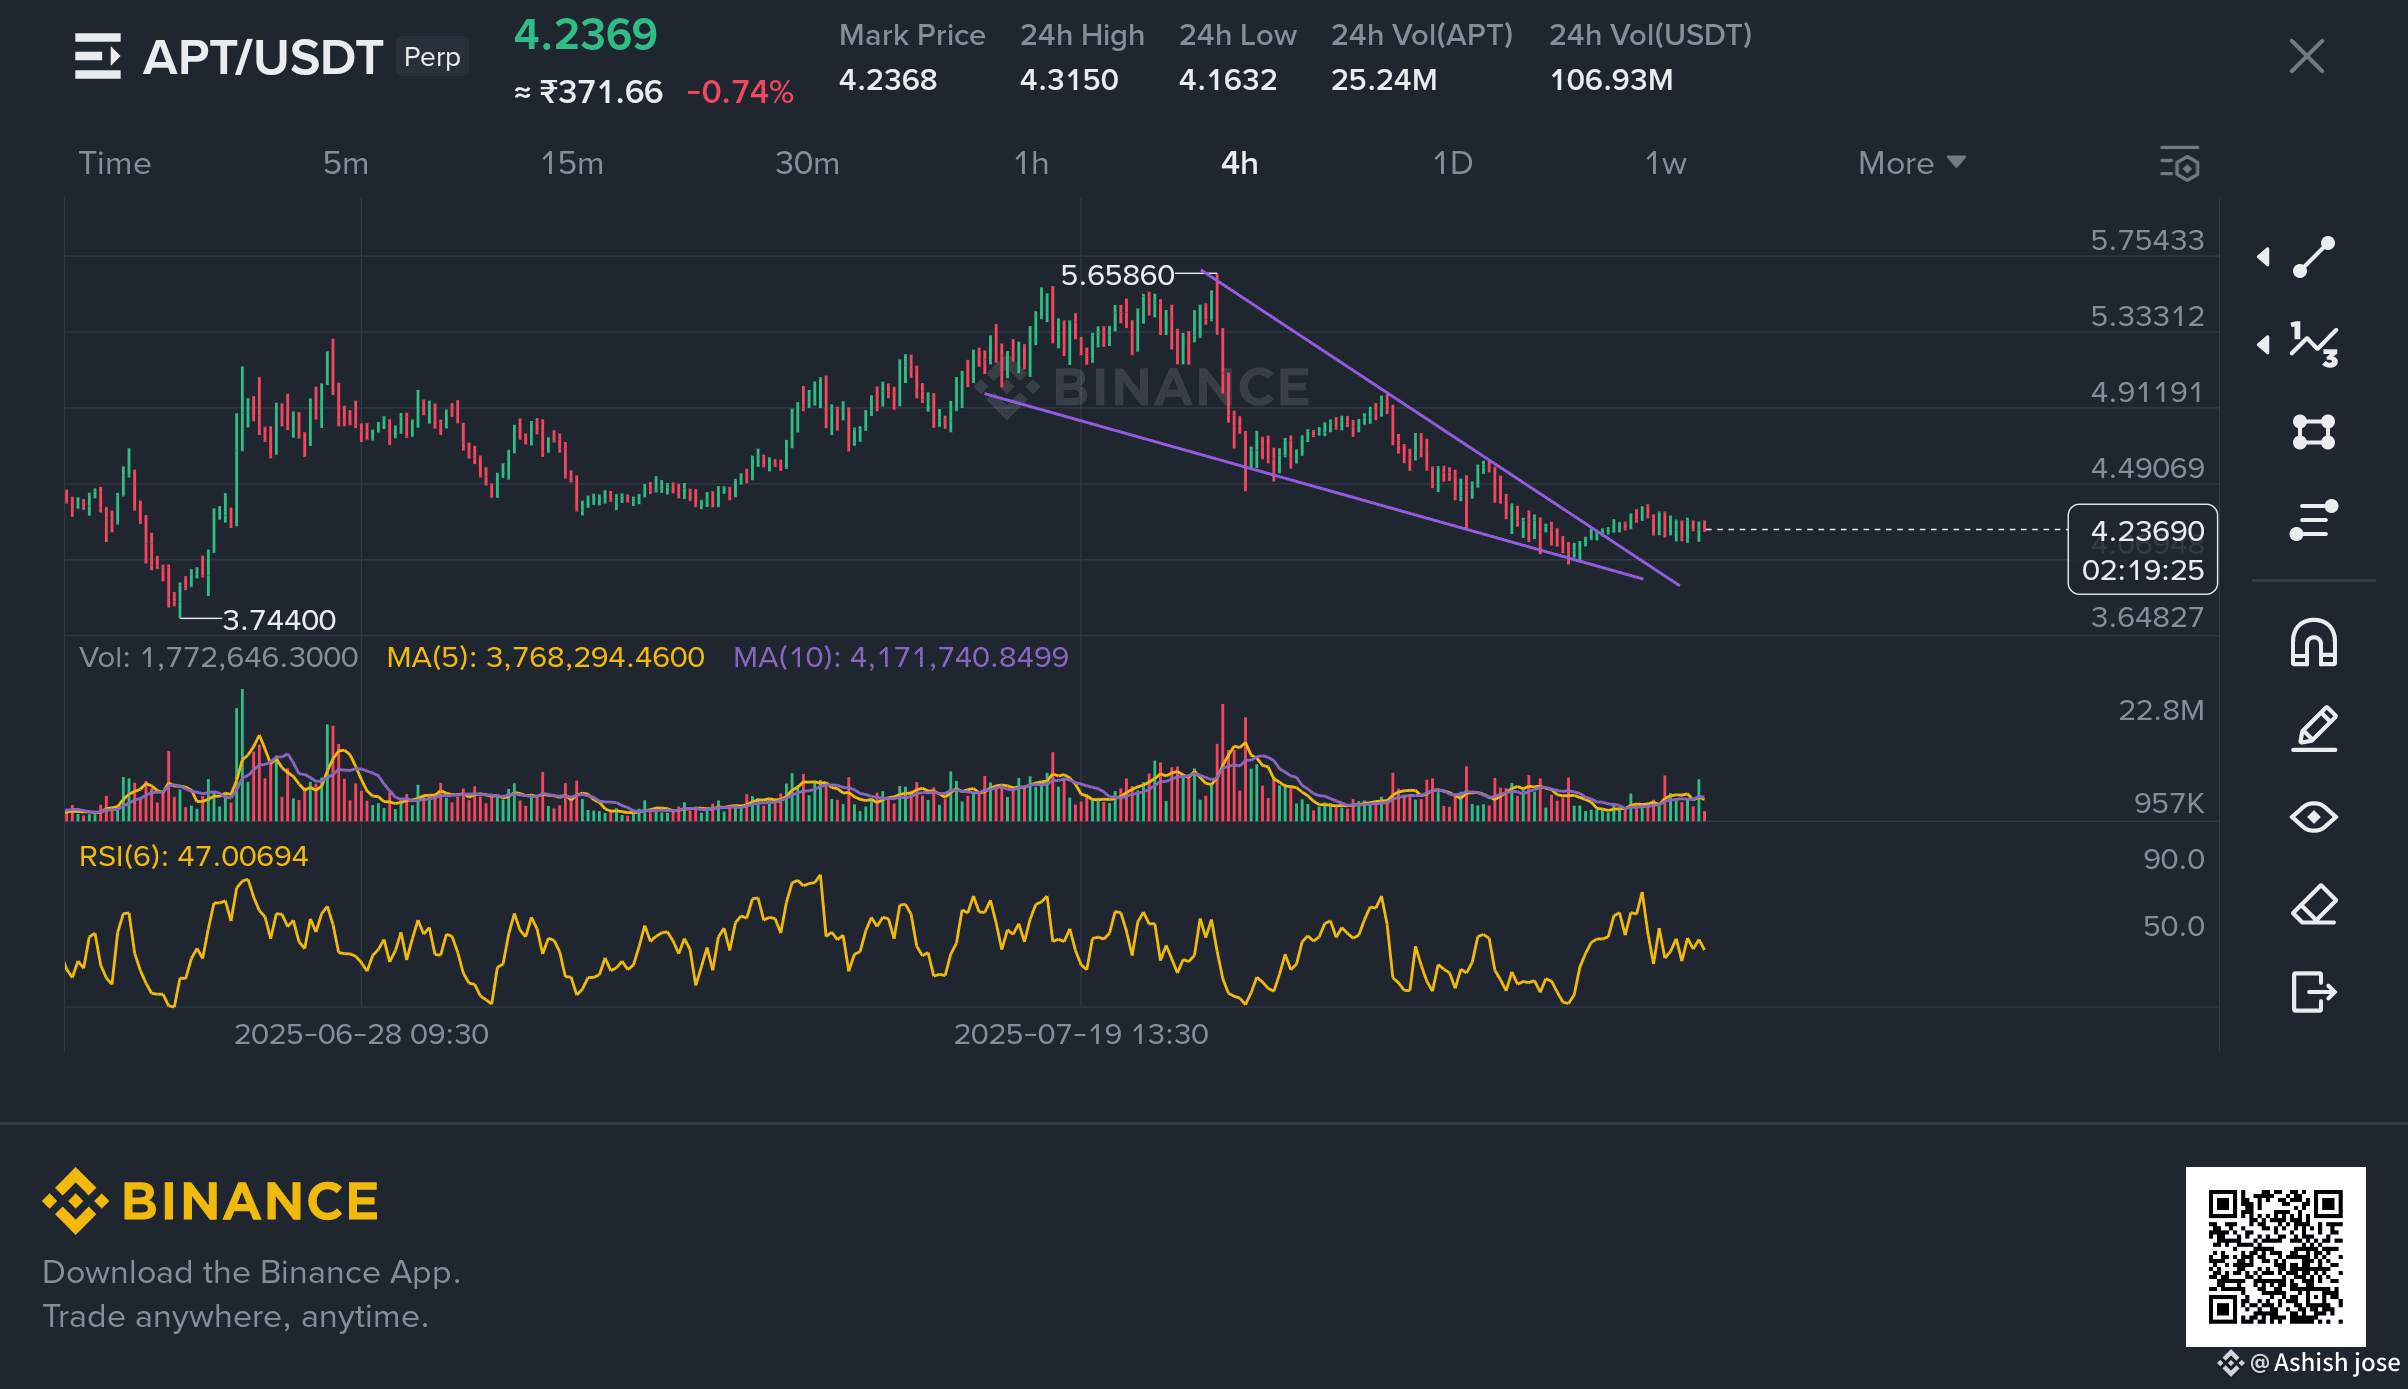
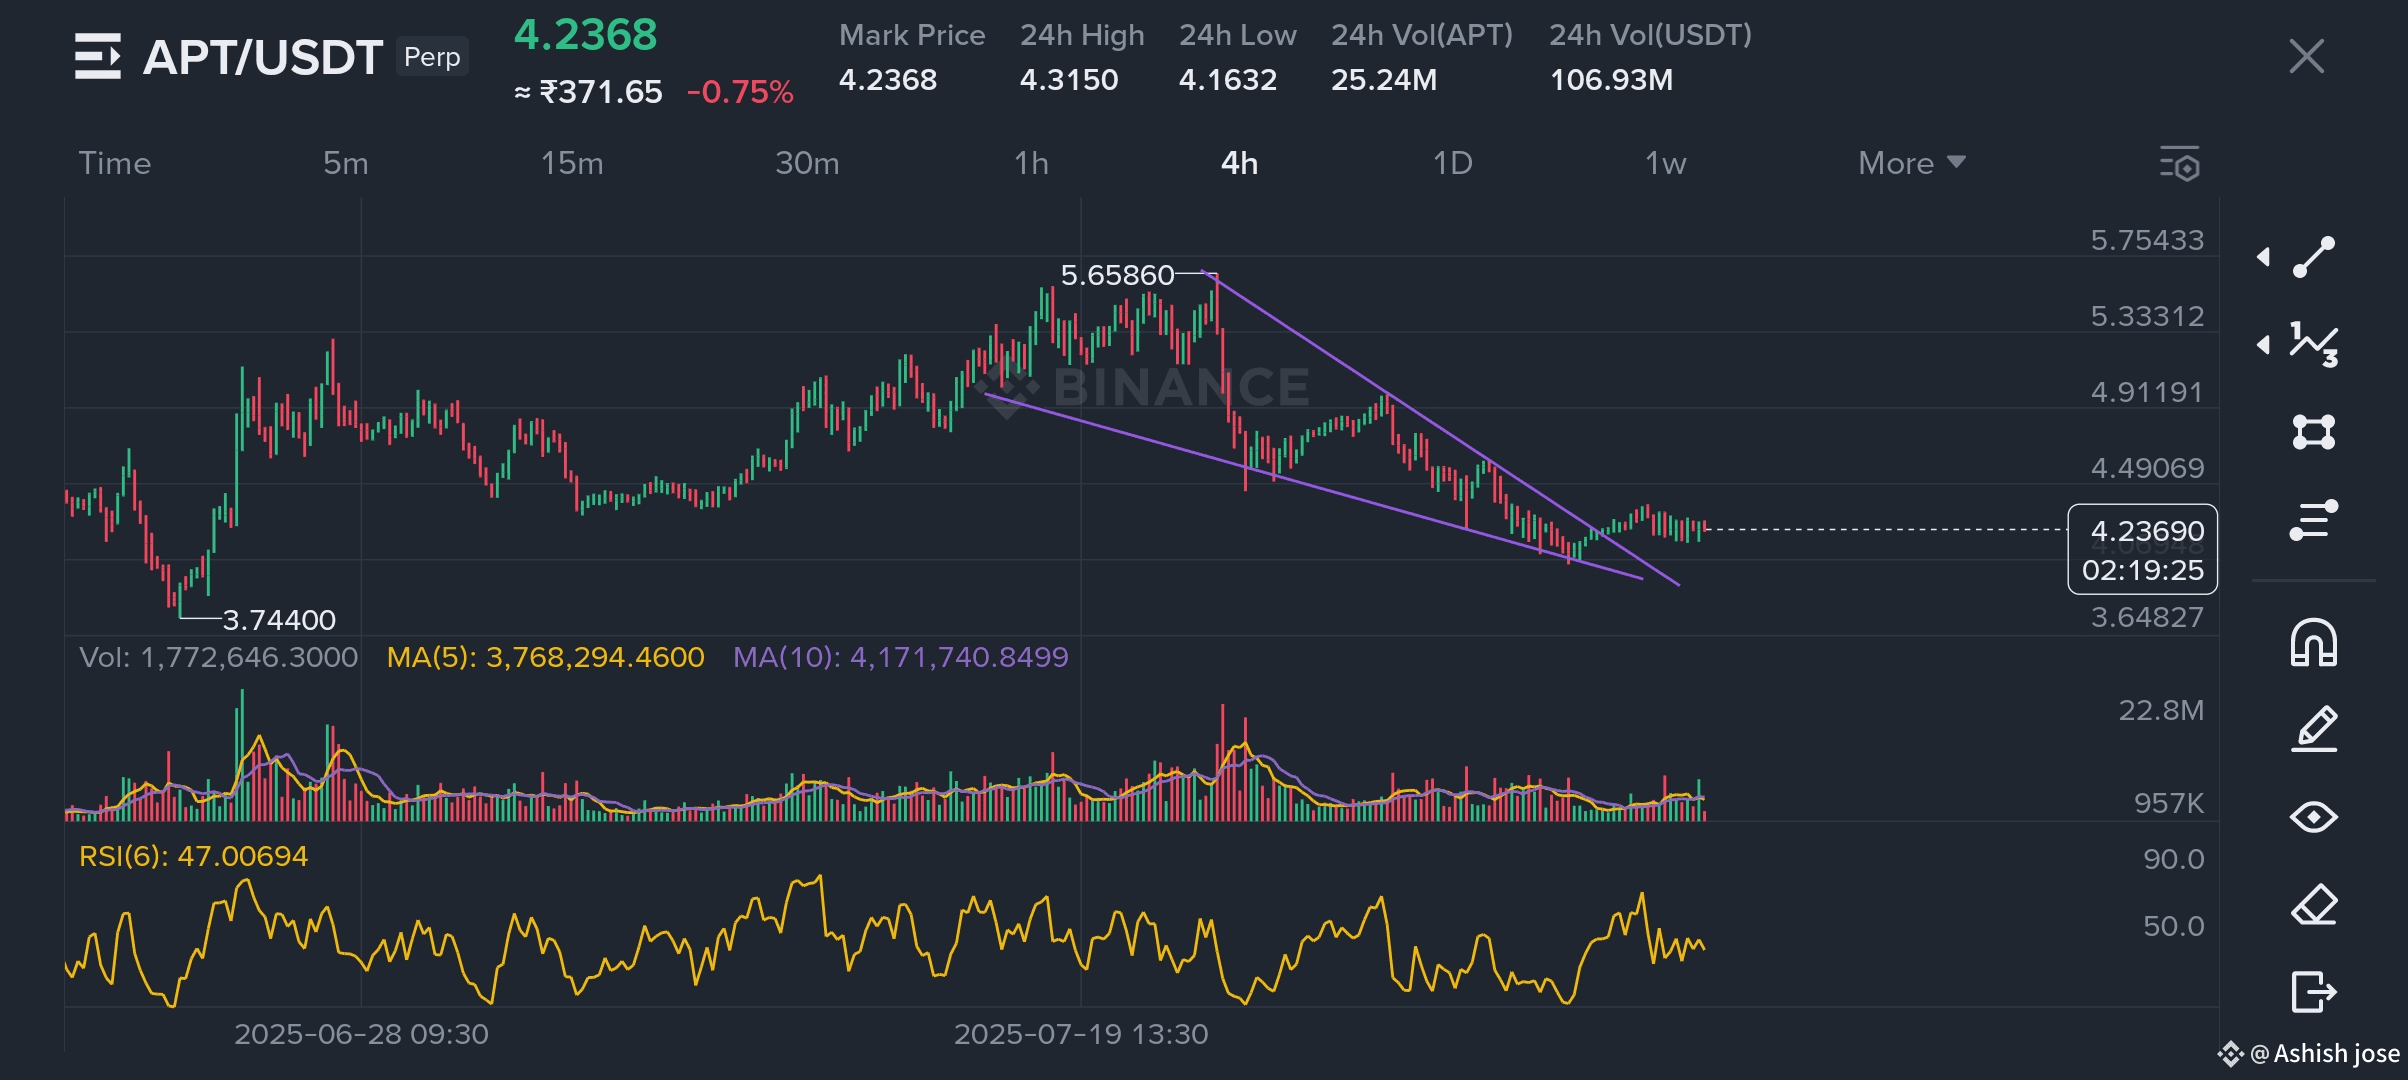
4-Hour (4H) Timeframe
General Outlook: The overall market mood remains bearish on the 4H chart, consistent with the dominant trends visible on other timeframes.
1-Day (1D) / Daily Timeframe
Trend: The daily chart is also bearish, with around 75% of moving averages showing downward pressure.
Entry:$4.24–$4.32
Target 1 :$3.93
Target 2 :$3.75
Extended Target:$3.00
Stoploss: $4.32–$4.35