1. 𝘽𝙪𝙮𝙚𝙧𝙨 𝙞𝙣 𝙁𝙪𝙡𝙡 𝘾𝙤𝙣𝙩𝙧𝙤𝙡 🟢
Pattern: Big Green Candle
What It Means: This is a bullish powerhouse! A long green candle signals strong buying momentum with buyers dominating the session from start to finish.
Trading Tip: Look for these candles during uptrends or at key support levels to confirm bullish strength. It's a green light for potential entries! 🚀
2. 𝙎𝙚𝙡𝙡𝙚𝙧𝙨 𝙏𝙧𝙞𝙚𝙙 𝙗𝙪𝙩 𝘽𝙪𝙮𝙚𝙧𝙨 𝙒𝙤𝙣 🟢
Pattern: Green Candle with Long Lower Wick
What It Means: Sellers pushed prices down, but buyers fought back hard closing the session higher. This shows resilience and bullish recovery.
Trading Tip: Spot this at support zones—it's a sign buyers are stepping in to defend the price. A great setup for a potential reversal! 💪
3. 𝙈𝙖𝙧𝙠𝙚𝙩 𝙄𝙣𝙙𝙚𝙘𝙞𝙨𝙞𝙤𝙣: 𝙏𝙝𝙚 𝘿𝙤𝙟𝙞 𝙎𝙩𝙖𝙣𝙙𝙤𝙛𝙛 🟫
Pattern: Doji Candle (Small Body Equal Wicks)
What It Means: Buyers and sellers are locked in a tug-of-war with neither side winning. This signals uncertainty and a potential pause in the trend.
Trading Tip: Watch for dojis after strong trends—they often precede reversals or consolidations. Wait for confirmation before acting! ⏳
4. 𝘽𝙪𝙮𝙚𝙧𝙨 𝙋𝙪𝙨𝙝𝙚𝙙 𝙎𝙚𝙡𝙡𝙚𝙧𝙨 𝙋𝙪𝙨𝙝𝙚𝙙 𝘽𝙖𝙘𝙠 🟢
Pattern: Green Candle with Long Upper Wick
What It Means: Buyers drove prices up but sellers rejected the move forcing a lower close. This shows weakening bullish momentum.
Trading Tip: Be cautious—this could signal a reversal especially near resistance levels. Look for follow-through selling pressure. ⚠️
5. 𝙎𝙚𝙡𝙡𝙚𝙧𝙨 𝙞𝙣 𝙁𝙪𝙡𝙡 𝘾𝙤𝙣𝙩𝙧𝙤𝙡 🟥
Pattern: Big Red Candle
What It Means: Bearish dominance! A long red candle means sellers overwhelmed buyers driving prices down decisively.
Trading Tip: These candles often appear in downtrends or at resistance breaks. Consider shorting or exiting longs when you see this! 📉
6. 𝘽𝙪𝙮𝙚𝙧𝙨 𝙁𝙤𝙪𝙜𝙝𝙩 𝘽𝙖𝙘𝙠 𝘼𝙜𝙖𝙞𝙣𝙨𝙩 𝙎𝙚𝙡𝙡𝙚𝙧𝙨 🟥
Pattern: Red Candle with Long Lower Wick
What It Means: Sellers pushed prices down but buyers stepped in to recover some ground before the close. This hints at potential bullish strength.
Trading Tip: Spot this at support levels—it could signal a reversal or buying opportunity if confirmed by volume or other indicators. 🛡️
7. 𝙄𝙣𝙙𝙚𝙘𝙞𝙨𝙞𝙤𝙣 𝙍𝙚𝙞𝙜𝙣𝙨 𝘼𝙜𝙖𝙞𝙣 🟧
Pattern: Small-Bodied Candle with Wicks
What It Means: Neither buyers nor sellers have control creating a tight range and market uncertainty.
Trading Tip: Avoid trading during these periods unless you're scalping. Wait for a breakout or stronger signal to act. 🕒
8. 𝙎𝙚𝙡𝙡𝙚𝙧𝙨 𝙇𝙚𝙙 𝙗𝙪𝙩 𝘽𝙪𝙮𝙚𝙧𝙨 𝙍𝙚𝙨𝙞𝙨𝙩𝙚𝙙 🟥
Pattern: Red Candle with Long Lower Wick
What It Means: Sellers drove prices lower but buyers rejected the move pushing prices up before the close. This shows buyer resilience.
Trading Tip: Look for this near support zones—it's a clue that buyers are stepping in potentially signaling a reversal. 📈
𝙒𝙝𝙮 𝘾𝙖𝙣𝙙𝙡𝙚𝙨𝙩𝙞𝙘𝙠𝙨 𝘼𝙧𝙚 𝙖 𝙂𝙖𝙢𝙚-𝘾𝙝𝙖𝙣𝙜𝙚𝙧 🧠
Candlestick patterns are like a window into market psychology. Here's the breakdown:
Long Candles: Show clear strength and conviction (bullish or bearish).
Dojis/Small Bodies: Signal indecision—perfect for spotting pauses or reversals.
Wicks: Highlight rejection or recovery showing where buyers or sellers fought back.
By mastering these patterns you can read the emotions behind price movements and make informed trading decisions. Combine them with support/resistance levels volume and other indicators for maximum accuracy! 🔥
𝙃𝙤𝙬 𝙩𝙤 𝙐𝙨𝙚 𝙏𝙝𝙞𝙨 𝙆𝙣𝙤𝙬𝙡𝙚𝙙𝙜𝙚 𝙞𝙣 𝘾𝙧𝙮𝙥𝙩𝙤 𝙏𝙧𝙖𝙙𝙞𝙣𝙜
Confirm Trends: Use big candles to confirm bullish or bearish momentum in trending markets like #BTC or #ETH.
Spot Reversals: Look for wicks or dojis at key levels to catch potential trend changes especially in volatile markets like #Solana or #Notcoin.
Avoid Traps: Indecision candles (dojis small bodies) warn you to stay out until the market picks a direction.
Combine Tools: Pair candlesticks with RSI, moving averages, or Fibonacci levels for stronger signals.
𝙂𝙚𝙩 𝙎𝙩𝙖𝙧𝙩𝙚𝙙 𝙉𝙤𝙬! 🚀
Ready to level up your crypto trading? Start practicing these candlestick patterns on platforms like TradingView or your favorite exchange. Whether you're trading #BTCUnbound #IPOWave or #BuiltonSolayer these patterns work across all crypto markets. Stay disciplined manage risk and always wait for confirmation to avoid costly mistakes.
💬 𝙒𝙝𝙖𝙩'𝙨 𝙮𝙤𝙪𝙧 𝙛𝙖𝙫𝙤𝙧𝙞𝙩𝙚 𝙘𝙖𝙣𝙙𝙡𝙚𝙨𝙩𝙞𝙘𝙠 𝙥𝙖𝙩𝙩𝙚𝙧𝙣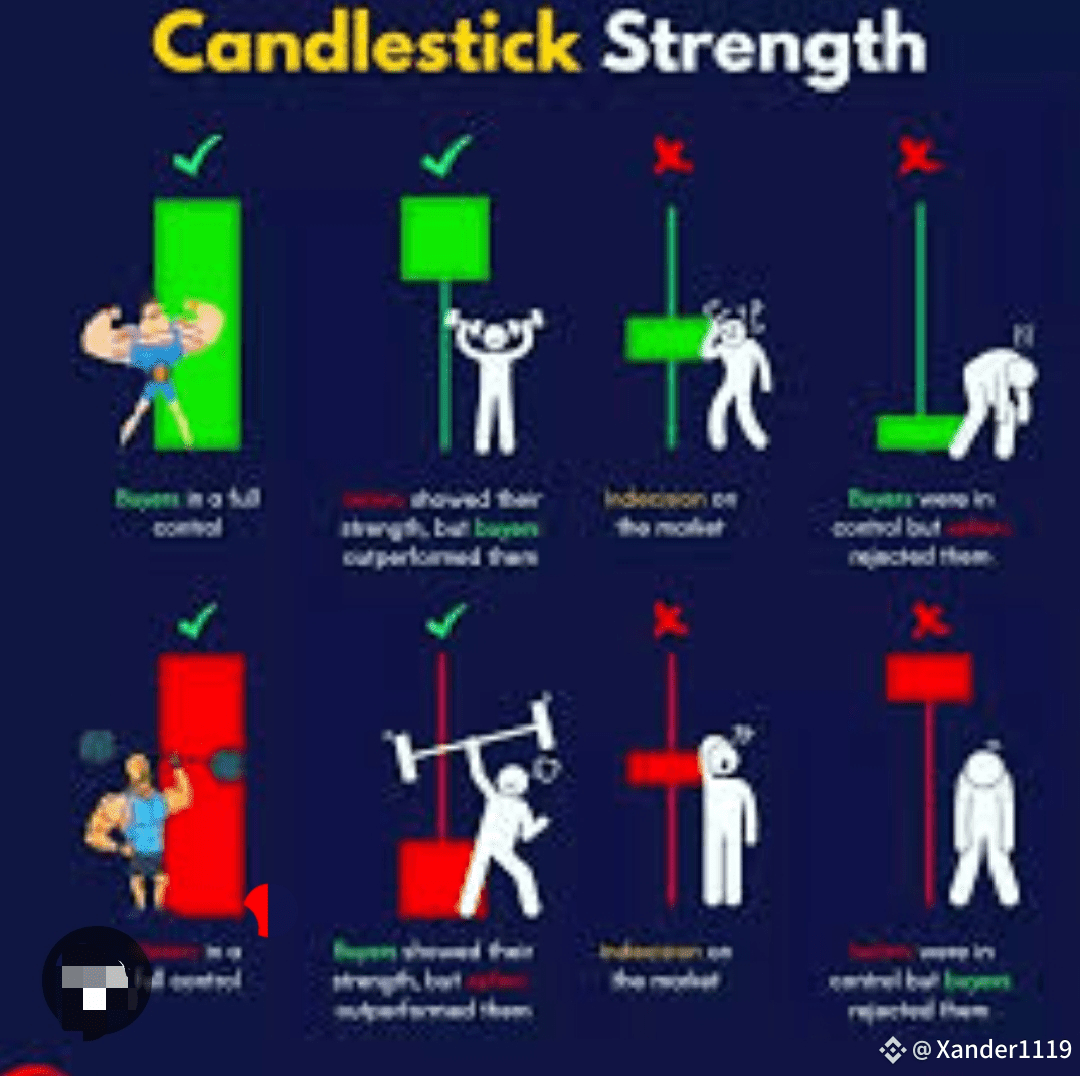 ? Drop a comment like and follow for more crypto trading tips! Let's ride the #CFTCCryptoSprint together! 🌟#BinanceSquare