
Ethereum ($ETH ) has dipped beneath the $3,700 mark, raising questions about whether this is a minor pause or the beginning of a broader pullback. After a period of heightened volatility and failed attempts to reclaim key resistance levels, ETH is showing signs of short-term weakness. The recent rejection from the $3,860 zone — now acting as a critical psychological barrier — reflects waning buying strength despite strong rebounds from local lows near $3,360.
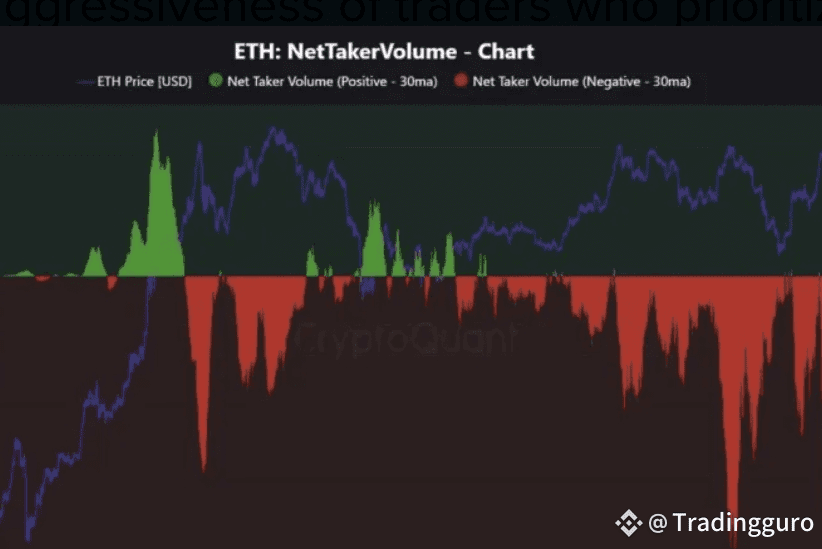
Top on-chain analyst Maartunn recently pointed out that Ethereum’s net trading volume has turned significantly negative, sitting at -418.8 million USD daily. This reflects a notable imbalance where sellers have offloaded around 115,400 ETH more than buyers are absorbing via market orders — a clear indicator of bearish pressure. Such behavior suggests that sellers are acting aggressively, prioritizing immediate execution rather than optimal pricing, which typically signals short-term fear or profit-taking.
While these metrics indicate bearish dominance in the short term, the broader structure remains largely intact. Long-term indicators like the 50-day moving average (currently at $3,059) continue to slope upward, with the 100-day MA ($2,742) and 200-day MA ($2,503) providing structural support beneath. These levels show the underlying bullish trend is still present, even as ETH experiences consolidation.
Importantly, Ethereum’s fundamentals remain strong — with institutional adoption increasing, on-chain development continuing, and broader market support building. Many analysts interpret the current decline as a healthy consolidation phase following ETH’s rally to a local high of $3,940, rather than a full trend reversal.
If Ethereum can reclaim and hold above the $3,860 resistance level, it could reignite bullish momentum and open the door for a fresh leg upward. However, if bearish pressure continues and ETH fails to find support around $3,360, further downside could emerge.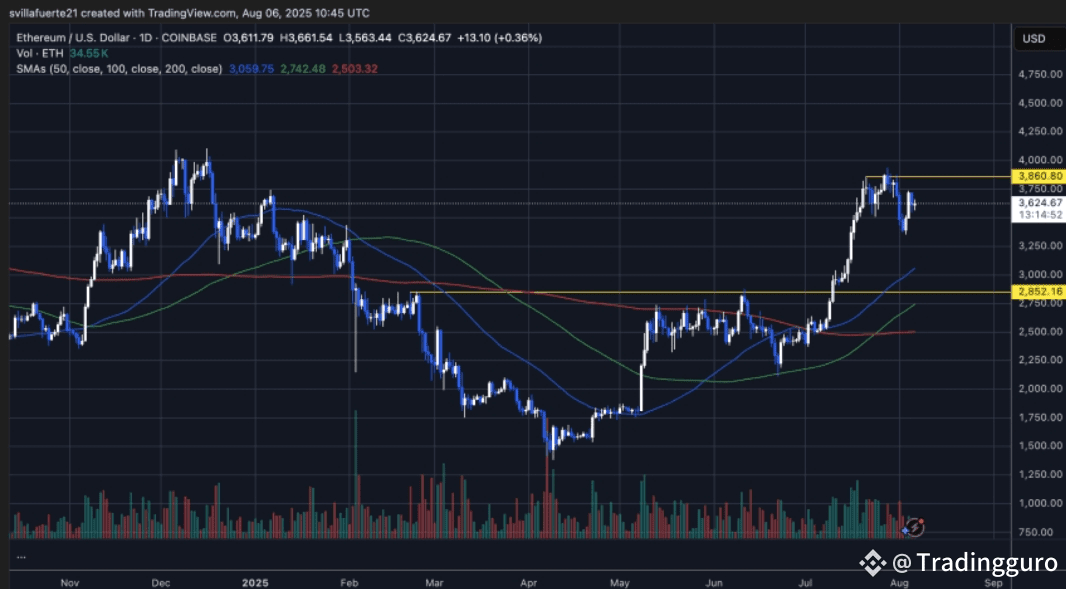
📉 Key Levels to Watch:
Resistance: $3,860
Support: $3,360
50-Day MA: $3,059 (Bullish Indicator)
100-Day & 200-Day MA: Strong Long-Term Support Zones
Ethereum is at a critical juncture. Whether this pause turns into a new upward wave or a deeper retracement will depend on the next few daily closes and market sentiment.

