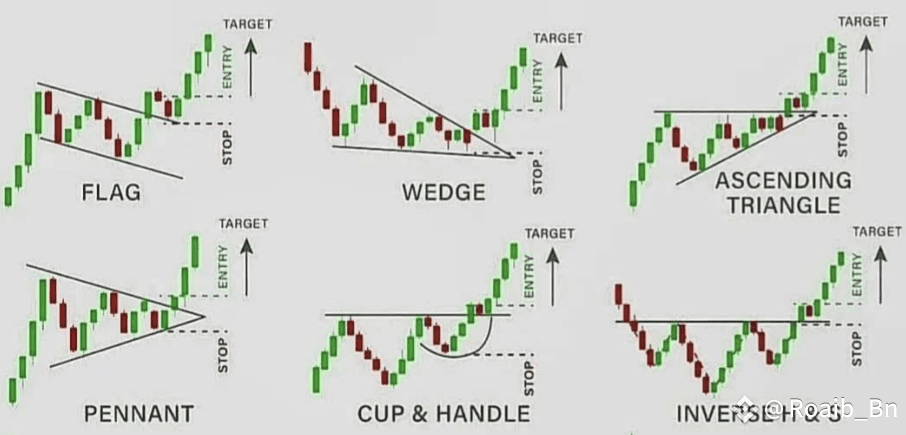
1. Flag Pattern
A sharp move followed by a small downward channel.
Entry: Breakout above the flag
Stop: Below recent support
Target: Height of the flagpole
📈 Quick continuation of trend with strong momentum.
---
🔺 2. Wedge Pattern
Price consolidates within narrowing lines.
Entry: Breakout of the wedge
Stop: Below the lowest wedge point
Target: Similar to previous uptrend length
📈 Shows exhaustion and sets up for explosive breakout.
---
🔼 3. Ascending Triangle
Flat resistance with rising lows.
Entry: Breakout above horizontal resistance
Stop: Just below the triangle
Target: Height of the triangle
📈 A classic breakout signal from bullish consolidation.
---
🔻 4. Pennant Pattern
Short-term symmetrical triangle after a strong move.
Entry: Breakout in the trend direction
Stop: Below the pennant base
Target: Length of the flagpole
📈 Small structure but big potential.
---
☕ 5. Cup & Handle
Price forms a U-shape (cup) followed by a slight dip (handle).
Entry: Breakout above resistance
Stop: Below the handle
Target: Depth of the cup
📈 Shows strong accumulation before breakout.
---
🧠 6. Inverse Head & Shoulders
Three dips with the middle one (head) being the deepest.
Entry: Breakout above neckline
Stop: Below right shoulder
Target: Distance from head to neckline
📈 Indicates a reversal of a downtrend into bullish momentum.
---
📷 HERE is the candlestick pattern image 👇
🔔 If you found this post helpful, don’t forget to follow, like, and comment to support more trading education!
#notcoin #BuiltonSolayer #IPOWave #BTCUnbound #CFTCCryptoSprint