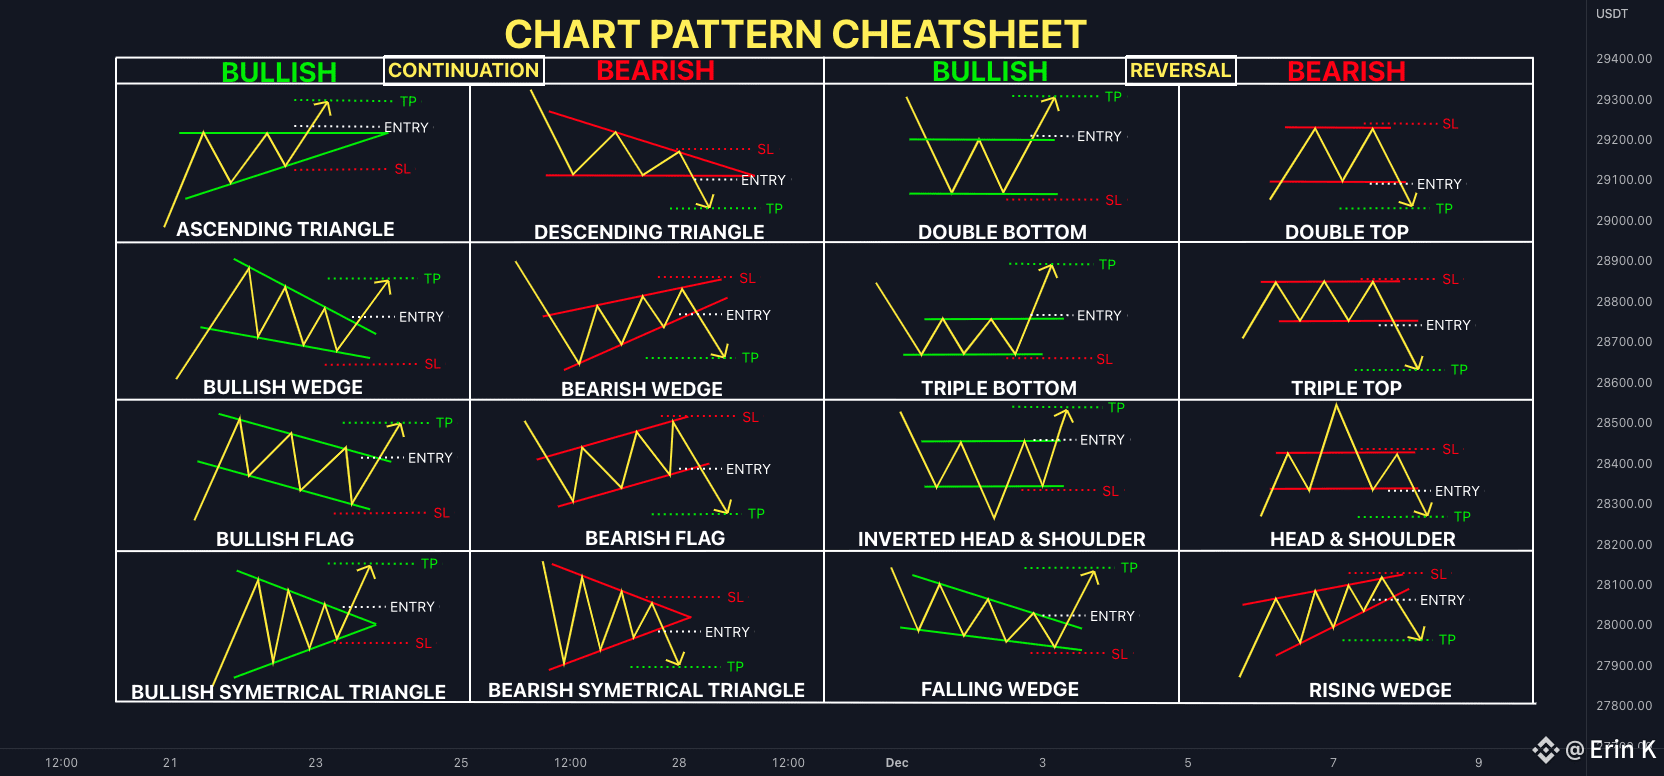
1️⃣ Falling Wedge ⬇️➡️⬆️ (Super Bullish)
Price squeezes downward → breakout UP = trend reversal.
🎯 Target = height of wedge.
2️⃣ Symmetrical Triangle 🔺 (Bull Bias)
Sideways chop in a triangle → breakout usually follows the trend (bullish continuation).
3️⃣ Double Bottom 💪 (W Pattern)
Two lows form a “W” → breakout above neckline = bullish reversal.
4️⃣ Rising Wedge ⬆️➡️⬇️ (Bearish Alert)
Price creeps up in shrinking wedge → downside breakout signals trend reversal.
5️⃣ Bearish Symmetrical Triangle 🔻 (Continuation)
Forms in downtrend → breakdown = bearish trend resumes.
6️⃣ Double Top 💀 (M Pattern)
Two highs form an “M” → break of neckline confirms bearish reversal.
---
🧠 Why Learn These?
✅ Spot reversals early
✅ Find sniper entries/exits
✅ Combine with volume = laser-accurate moves
---
Chart attached 👇
If this added value → HIT ❤️ & comment “PATTERNS” to unlock the next level! 🚀📊
#BTCUnbound #CFTCCryptoSprint #BinanceHODLerTOWNS #BTCReserveStrategy #BinanceHODLerPROVE