
Date: Wed, Aug 06, 2025 | 10:00 AM GMT
The cryptocurrency market is in the midst of a broad correction after Ethereum (ETH) faced rejection near the $3,940 level and slid to $3,620 — marking a 4% weekly decline. This weakness has spilled over to altcoins, with VeChain (VET) dropping 6% over the past week and trimming its monthly gains to 11%.
However, beneath the short-term bearish sentiment, the chart reveals something compelling — an emerging fractal pattern that closely mirrors a recent bullish structure seen in XRP, hinting at a potential bounce.
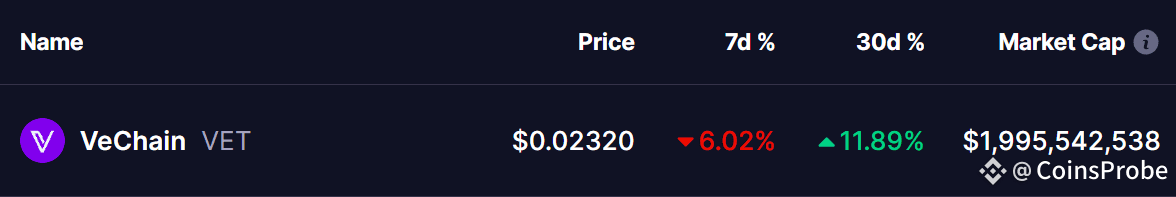
Source: Coinmarketcap
VET Mirrors XRP's Harmonic Structure
A side-by-side look at the daily charts of XRP and $VET shows a striking similarity.
Recently, XRP completed the CD leg of a bearish bat harmonic pattern, finding its C point near the 0.618 Fibonacci support of the BA leg. This support zone acted as a springboard, allowing XRP to reclaim its 50-day moving average before rallying over 90% toward point D.
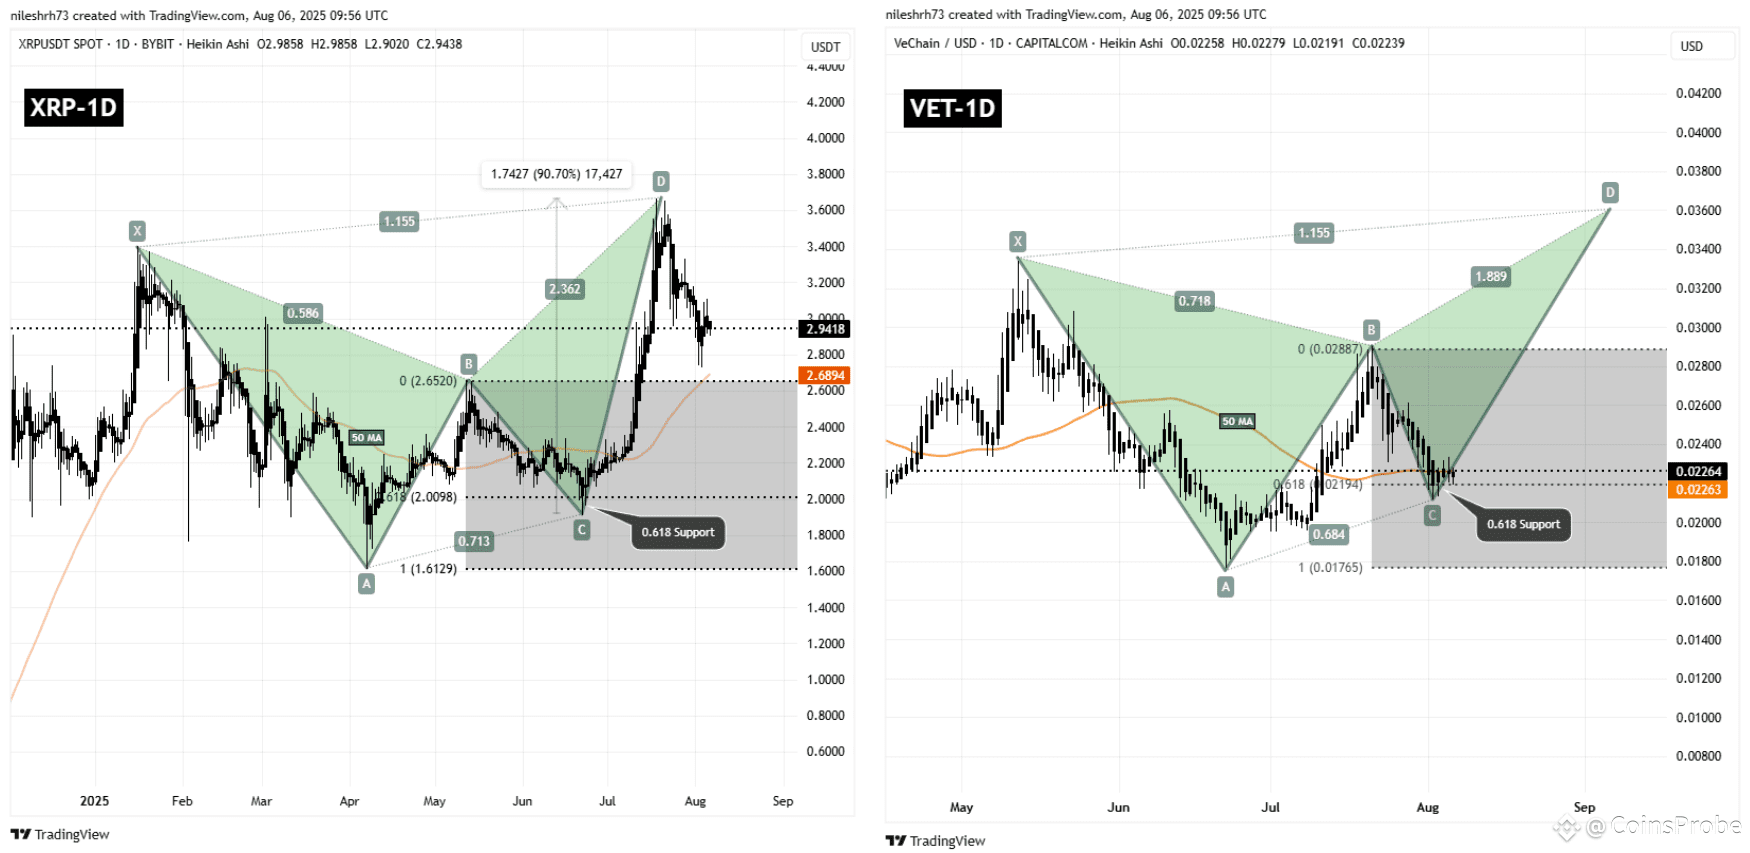
XRP and VET Fractal Chart/Coinsprobe (Source: Tradingview)
VET now appears to be following this same blueprint. The token is holding near the 0.618 Fibonacci support of the BA leg and is hovering around the 50-day moving average — exactly where XRP began its strong move toward point D.
What’s Next for VET?
If VET can maintain its position above the 50-day moving average and follow this fractal pattern, it could confirm the structure for a second leg higher. Based on the setup, the token could climb another 58% toward the projected target of $0.036 before the pattern completes.
However, to keep the bullish outlook intact, VET must hold key support at the 0.618 Fib level and point C at $0.02114. A breakdown below these levels could invalidate the setup.
Disclaimer: This article is for informational purposes only and not financial advice. Always conduct your own research before investing in cryptocurrencies.


