
Date: Tue, Aug 05, 2025 | 06:58 AM GMT
The cryptocurrency market is staging a mild recovery after the recent sharp decline, with Ethereum (ETH) bouncing to $3,650 from its recent low of $3,357. Following this, several altcoins have joined the rebound — including Solana (SOL).
$SOL is back in the green today with a 4% daily gain, extending its monthly rally to 13%. Its latest chart now reveals a key harmonic setup that could point toward more upside in the near term.
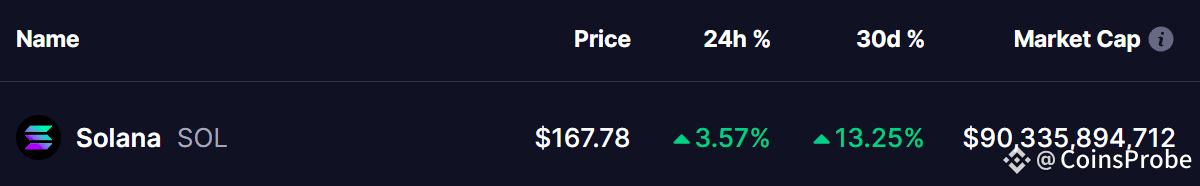
Source: Coinmarketcap
Harmonic Pattern Hints at Potential Bounce
On the daily chart, SOL is forming a Bearish ABCD harmonic pattern — a structure that, despite its name, often features a bullish CD-leg before reaching the final Potential Reversal Zone (PRZ).
The move began with a rally from Point A near $145.35 to Point B, followed by a retracement to Point C around $155.91, where buyers stepped back in. Since then, SOL has climbed to around $167.39, suggesting the CD leg is underway.
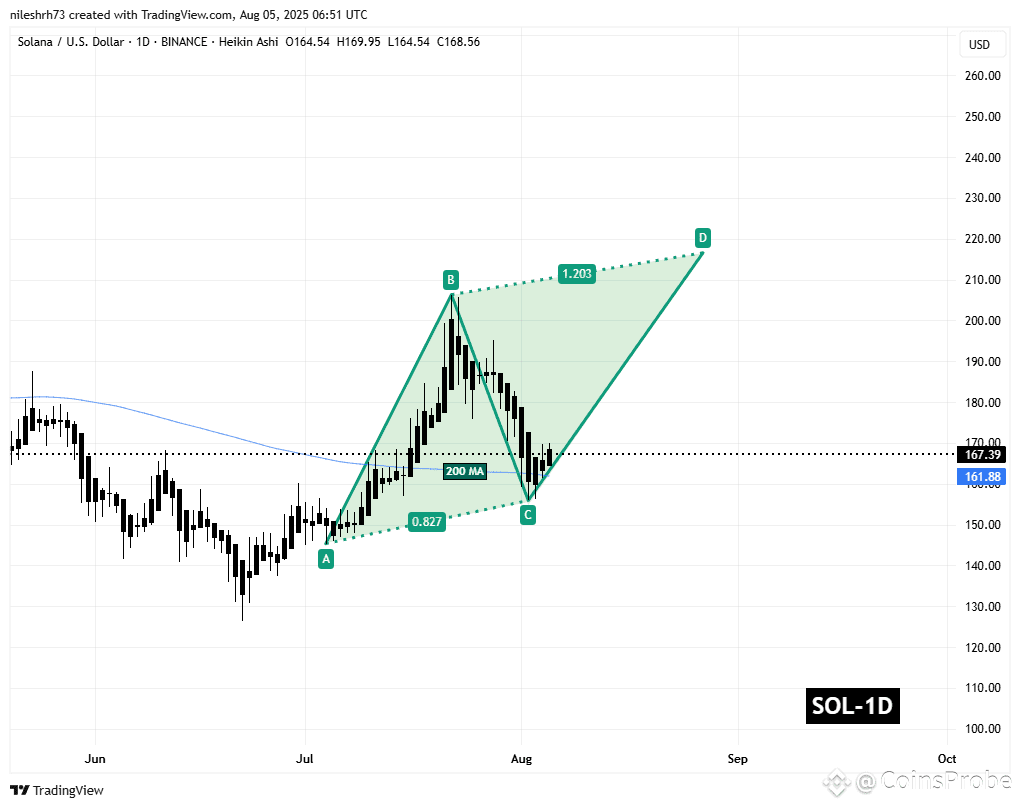
Solana (SOL) Daily Chart/Coinsprobe (Source: Tradingview)
If the pattern plays out according to the traditional ABCD framework, the CD leg could extend to the 1.20 Fibonacci projection of the BC leg, putting the PRZ around $216.56 — about 28% higher from current prices.
What’s Next for SOL?
If bullish momentum holds, SOL could continue toward the $216.56 zone, though this level is likely to serve as a major resistance where profit-taking or short-term pullbacks may occur. On the downside, the 200-day moving average near $161.88 is a crucial support to maintain the bullish structure.
Disclaimer: This article is for informational purposes only and not financial advice. Always conduct your own research before investing in cryptocurrencies.


