5000 to 50000: A two-step approach to cryptocurrency contract trading
Want to leverage 5,000 yuan (about 700 units) to get a 10x return? The key lies in the proper use of contract leverage, but the premise is to avoid emotional manipulation. First, split the principal into 300 units to start, and proceed in two steps:
Step 1: Trial and error with small capital (300U→1100U)
When using 100U to trade popular cryptocurrencies, strictly adhere to two rules:
Stop when the profit doubles (exit immediately when 100U becomes 200U);
Stop loss decisively when the loss reaches 50U.
If you win three rounds in a row (100 → 200 → 400 → 800), your initial capital can quickly roll to 1100U. During this stage, you should focus on building your skill. Stop after a maximum of three rounds and avoid being too greedy or aggressive. Luck plays a significant role, so knowing when to quit is key.
Step 2: Combined Strategy (Starting from 1100U)
After the funds reach the target, they are divided into three types of operations to disperse risks and improve profit efficiency:
High-Frequency Short-Term Arbitrage (100U): Focus on mainstream cryptocurrencies like BTC and ETH, monitoring fluctuations over a 15-minute period. If a sudden surge occurs, follow the trend and immediately take profit when you reach 3%-5%. Accumulate profits through high-frequency, small profits.
Fixed investment layout (15U per week): Use 15U to layout BTC contract long positions every week. Based on long-term trend judgment (such as expected increase from $50,000 to $100,000), do not panic during the decline. Hold the position for 6 months to 1 year. It is suitable for those who have limited time.
Heavy positions in trend trading (with excess funds): Capture significant market trends driven by macro signals (such as expectations of a Fed rate cut) and enter trades decisively. However, clearly define take-profit (e.g., exit at double the price) and stop-loss (maximum loss of 20%) in advance. Beginners should master basic analysis before entering into trades.
Remember these four points!!!
The single position does not exceed 10% of the principal, and never go all-in;
Each order must have a stop loss to prevent carrying orders;
No more than 3 orders are allowed per day, and you will be forced to exit the market when you feel itchy.
Withdraw cash as soon as the target is reached, avoiding the greedy trap of “making another profit”.
Those who can break through with this method never rely on luck - discipline is the core: be ruthless to risks and even more ruthless to greed.
This method is also something I have personally tested. It is an executable and feasible method that I have summarized after hundreds of days and nights. I started with a capital of less than 8,000 yuan and have earned tens of millions today!
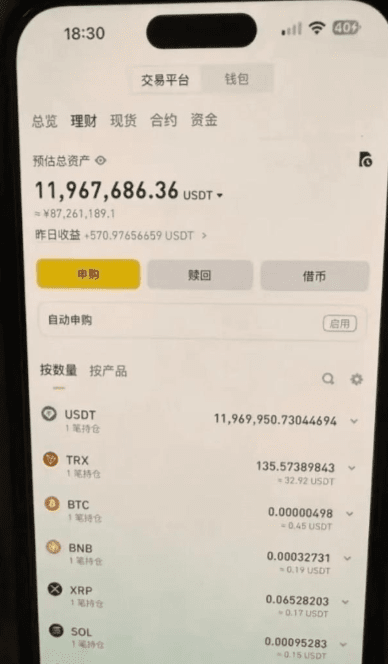
I've thought about it for a long time, and I've decided to share my secret formula for how I started with a small portfolio and achieved my current level of enlightenment. If you have less than 1 million yuan and want to double it quickly, please read this carefully. I believe it will help you. I've captured almost all of the gains in my holdings over the years! I still support my family by trading cryptocurrencies.
I've used 80% of the market's methods and techniques, but the most practical ones are these ironclad rules of cryptocurrency trading! If you want to make cryptocurrency trading a second career to support your family, then you must study this article carefully. It will save you at least 10 years of hard work.
Iron Rule 1: Trend Reversal Signal Recognition
In a downward trend, if there are more than three consecutive bullish rebounds, or if there are no more than three consecutive bearish pullbacks in an upward trend, this is likely to be a warning signal of a trend reversal, and must be paid close attention to.
Iron Rule 2: Guide to Oscillating Breakouts
In a volatile market, a period of rising volume and flat prices often leads to a major breakthrough. Operationally, you can buy on dips and wait for two periods of rising volume to exceed the previous period of falling volume, then intervene in advance to seize the opportunity.
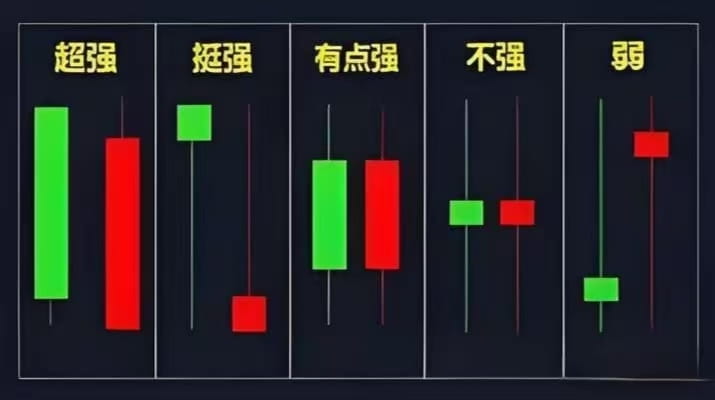
Iron Rule 3: Holding Currency in a Strong Market
The strategy for holding coins in a strong market is simple: as long as the daily line does not fall below the rising moving average, hold on firmly. Don't be distracted by technical indicators, especially when they are at high levels, so as not to get out too early.
Iron Rule 4: K-line combination analysis skills
A medium-sized yang line with two doji patterns is usually a sign of rising relay. This is also a typical rising pattern of strong currencies. Once discovered, you can actively follow up.
Iron Law 5: Unconventional Market Psychology
The market often runs counter to the majority opinion. The smokescreens released by the main players and the market tops often appear when everyone is optimistic. It is important to maintain independent thinking and think in reverse.
Iron Rule 6: Key Points for Using KDJ Indicator
When encountering a series of large negative lines, when the KDJ J line is less than -12, it means that a short-term rebound is about to come. At this time, don't rush to operate, wait until the rebound occurs before making a judgment, and avoid blindly buying the bottom.
Iron Rule 7: Key Characteristics of a Breakout Bullish Line
During an upward breakthrough, a Yang line turnover rate of around 8% is considered a healthy attack volume. If the turnover rate is too high or too low, it may trigger a callback and requires vigilance.
I'm Shanyuan, a veteran of multiple bull and bear cycles, and possess extensive market experience across multiple financial sectors. Follow our official account (CryptoTravel) to penetrate the fog of information and discover the real market. Seize more opportunities to unlock wealth and discover truly valuable opportunities. Don't miss out and regret it!
A must-learn for beginners! You must master the contract K-line chart when doing contracts. Once you learn it, you will be like a duck to water in the cryptocurrency world.
New to the cryptocurrency market and feeling overwhelmed by contract candlestick charts? Don't worry! Today, we'll teach you how to understand cryptocurrency contract candlestick charts in the simplest and most accessible way, helping you improve your trading skills, grasp market trends, and execute precise trades!
What is a contract candlestick chart?
First, we need to understand that candlestick charts are one of the most common chart types in cryptocurrency trading and are an important tool for determining market trends. They consist of information such as time period, opening price, closing price, highest price, and lowest price, helping you observe market price fluctuations.
The K-line chart is divided into charts of different time periods such as 1 minute, 5 minutes, 30 minutes, 1 hour, 4 hours, and daily lines. The shorter the period, the more suitable it is for short-term trading, while the longer the period, the more suitable it is for medium and long-term operations.
The basic composition of the K-line chart
Each candlestick in a candlestick chart represents price fluctuations over a specific time period. Each candlestick is primarily composed of a body and upper and lower wicks. Understanding these components will allow you to interpret more information from the chart.
1. Body
The body represents the area between the opening and closing prices.
If the close is higher than the open, and the body is green or white, it indicates an upward market.
If the closing price is lower than the opening price, the real body is red or black, indicating a falling market.
2. Upper and lower shadows (Wicks)
Upper shadow line: represents the difference between the highest price and the closing price or opening price during the time period.
Lower shadow: represents the difference between the lowest price and the opening or closing price during the time period.
How to interpret the trend of contract K-line chart?
The candlestick chart is not just made up of individual candlesticks. The combination of candlesticks can help us determine market trends. By observing the patterns of candlesticks, we can predict the possible market trends. The following are some common candlestick patterns:
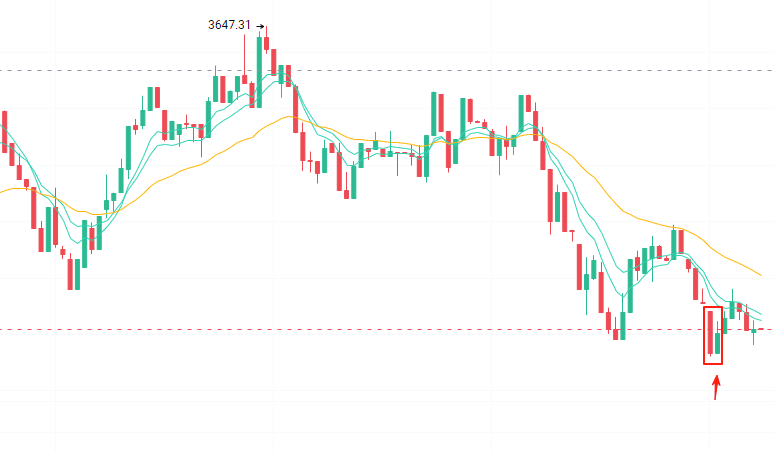
1. Engulfing
Bullish Engulfing: A large white candlestick engulfs the previous small black candlestick, suggesting that the market will rise.
Bearish Engulfing: A long black candlestick engulfs a small white candlestick, suggesting a downward trend in the market.
2. Hammer & Inverted Hammer
Hammer: A long lower shadow and a short real body, usually appearing after a downtrend, indicating that the market may reverse upwards.
Inverted Hammer: A long upper shadow and a short real body, usually appearing after an uptrend, indicating that the market may reverse downwards.
3. Doji
A doji indicates that the opening price and closing price are almost equal, and there is no obvious entity in the pattern, indicating uncertainty in the market and may be a turning signal.
How to use candlestick charts to make trading decisions?
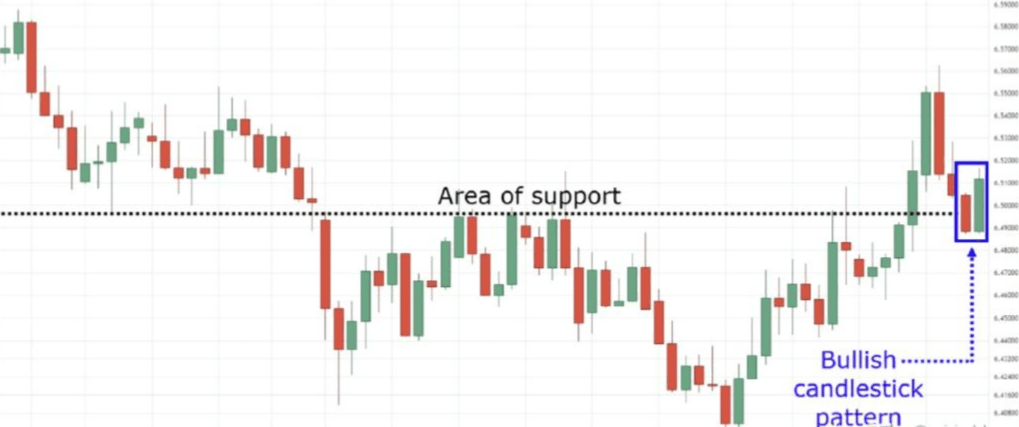
1. Find support and resistance levels
By observing the highs and lows in the candlestick chart, we can find support levels (levels at which prices may rebound if they fall) and resistance levels (levels at which prices may fall back if they rise).
Support level: When the price falls to a certain level, buying begins to increase and the price rebounds upward.
Resistance level: When the price rises to a certain level, selling begins to increase and the price falls back.
2. Identify the trend
By observing the trend of the K-line chart, you can determine whether the market trend is rising, falling or fluctuating.
Uptrend: Usually manifested as a continuous occurrence of higher highs and higher lows in the candlestick chart.
Downtrend: Usually manifested as a continuous occurrence of lower lows and lower highs in the candlestick chart.
Oscillating market: prices fluctuate within a certain range, and the K-line chart shows a relatively stable trend.
3. Combine with other technical indicators
K-line charts are often used in conjunction with other technical indicators, such as MACD, RSI, moving averages, etc., to help you more accurately determine buy and sell signals and market trends.
Common application skills of K-line charts
1. Trend lines and channels
By drawing trend lines (a straight line connecting low points or a straight line connecting high points) on the candlestick chart, you can visually see the market trend.
Rising Trend Line: Connects a series of gradually rising lows, indicating an upward trend in the market.
Downtrend line: Connects a series of gradually decreasing highs, indicating a downtrend in the market.
Price channel: It is composed of two upper and lower trend lines, indicating that the price fluctuates within a range.
2. Candlestick chart combination patterns
Learning common candlestick chart patterns, such as triangles, flags, rectangles, and head and shoulders tops, can help you determine potential market breakthrough directions.
Triangle pattern: Usually appears in the consolidation phase, with price fluctuations gradually narrowing, indicating that the market is about to break out.
️ Tips: How to improve your ability to understand candlestick charts?
Watch more and practice more: Only through continuous practice and review can you understand the K-line chart more accurately.
Use simulated trading: familiarize yourself with the changes in the candlestick chart through simulated trading without worrying about losses.
Be patient: You can’t learn to use candlestick charts overnight. You need to gradually accumulate experience to understand the deeper information of the market.
Summary: Understand the contract K-line chart and grasp the market easily!
By mastering the basic components of candlestick charts, common patterns, and trading decision-making techniques, you will be able to better understand cryptocurrency market trends and make more informed trading decisions.
Whether you're a beginner or an experienced trader, candlestick charts are an essential tool! Through continuous learning and practice, you'll be able to discover more trading opportunities and earn more profits!
Most retail investors only know how to read charts, but top professional traders use bullish candlestick patterns to make money! Let me share how I, as a top professional trader, make money. I've developed this method over two years, achieving a 98% win rate. In just six months, I've gone from 100,000 yuan to over 10 million yuan!
I believe most traders are familiar with bullish candlestick patterns such as:
Hammerhead
Bullish Engulfing
Morning Star
Whether you trade cryptocurrencies, stocks, forex, or cryptocurrencies, we will focus on how to use bullish candlestick patterns to create your own trading strategies and how to use them in real-world situations.
Let us first find out the real principles behind these bullish candlestick patterns.
The truth behind the bullish candlestick pattern
Before we dive into the technical concepts and strategies in this article, you must first understand the principles behind them.
In fact, bullish candlestick patterns are essentially chart patterns on lower time frames.
Bullish Engulfing:
Head and Shoulders Reversal Pattern:
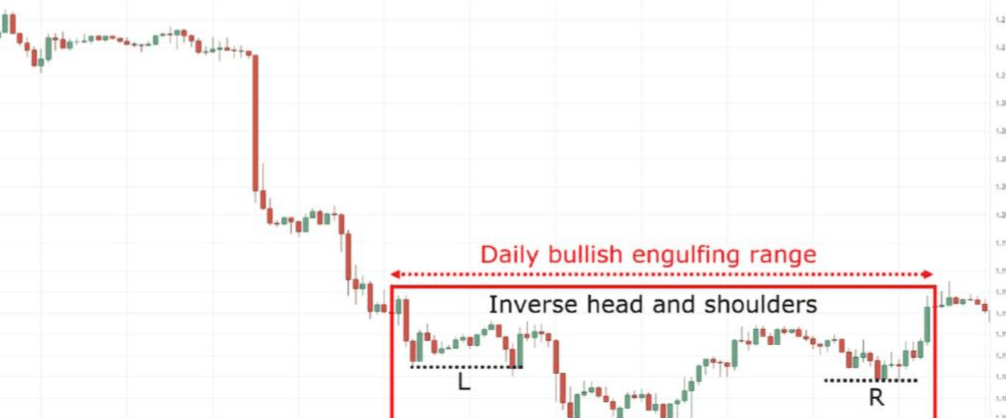
Meaning that for every bullish candlestick pattern seen on the lower timeframes, there is always a “story”, a “battle” between buyers and sellers.
Why is this important?
Here are the reasons:
Many traders may focus too much on a specific candlestick pattern before entering a trade.
“Oops, I have to wait for a bullish engulfing pattern before I can enter the trade.”
“A morning star candlestick pattern? Ugh, I’d rather wait for a hammer candlestick pattern.”
Additionally, bullish candlestick patterns can be irregular.
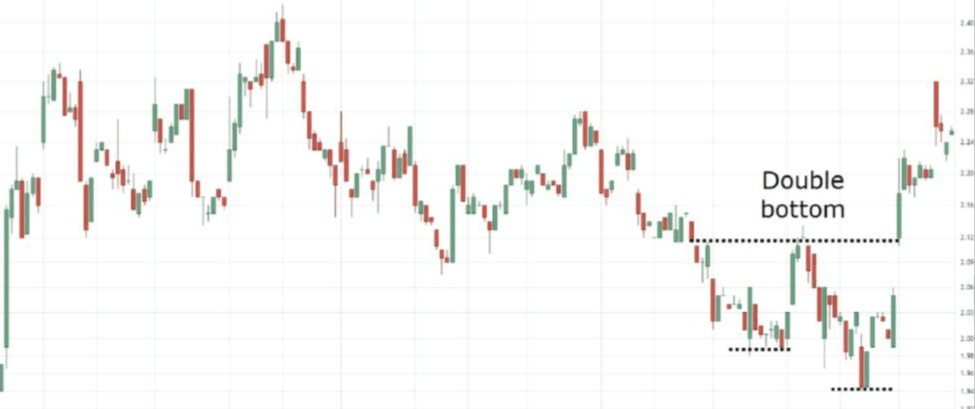
On the lower time frames, a double bottom pattern can be seen on the charts…
Double bottom pattern:
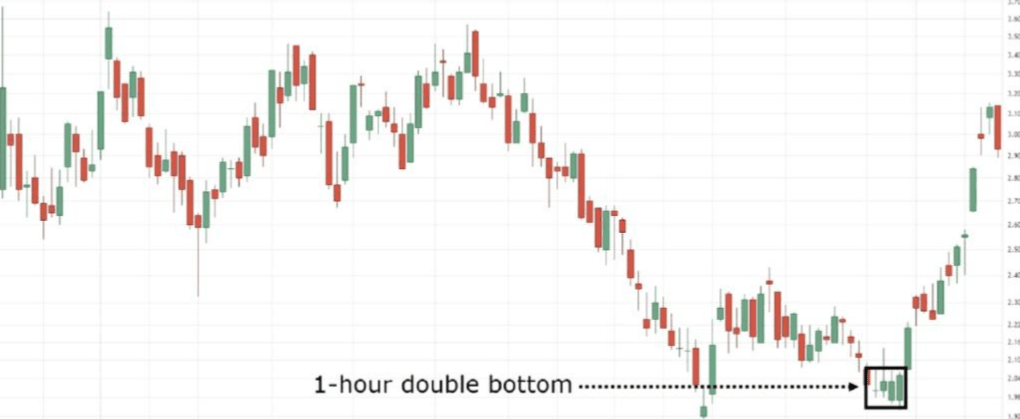
But on higher time frames, the entire pattern looks like this.
Double bottom pattern on the 1-hour chart:
Bullish candlestick pattern:
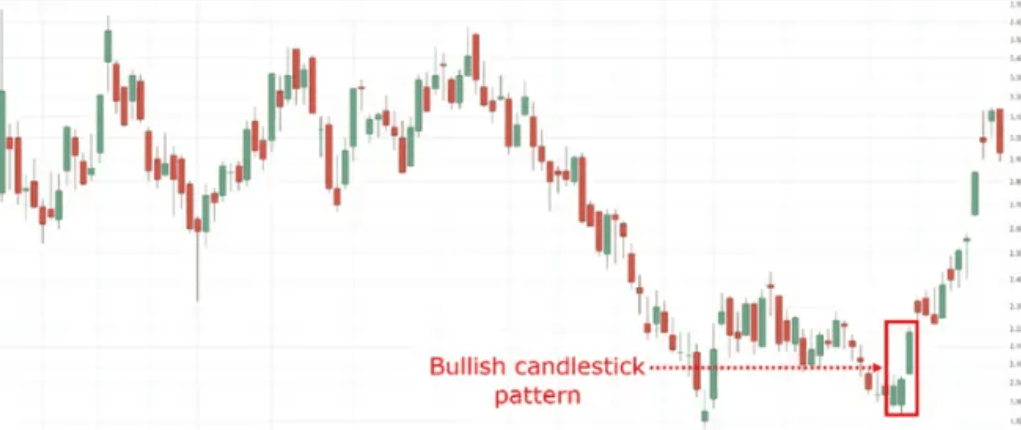
Would you still consider it a bullish candlestick pattern?
certainly!
So now you should know what a "real" bullish candlestick pattern is (again, it can be irregular).
So, how do you use them?
How to Find High Probability Bullish Candlestick Patterns to Trade
In order to have a complete trading strategy or a sound trading business, it is important to determine the following three things:
Trading Methods
Trading Setup
Transaction Management
Bullish candlestick patterns are designed to be used to time the entry and exit of trades.
On the other hand, if you spend too much time understanding your entries and exits, but don’t know yourself as a trader…
Then, no matter how high the bullish probability of your candlestick pattern is, you can expect to get inconsistent results.
This means that bullish candlestick patterns should only be a small part of the equation and should not be traded in isolation.
So, let’s learn how to trade the bullish candlestick pattern from top to bottom.
1. Trading Method
A trading approach to what you want from the markets is a crucial first step in achieving consistency.
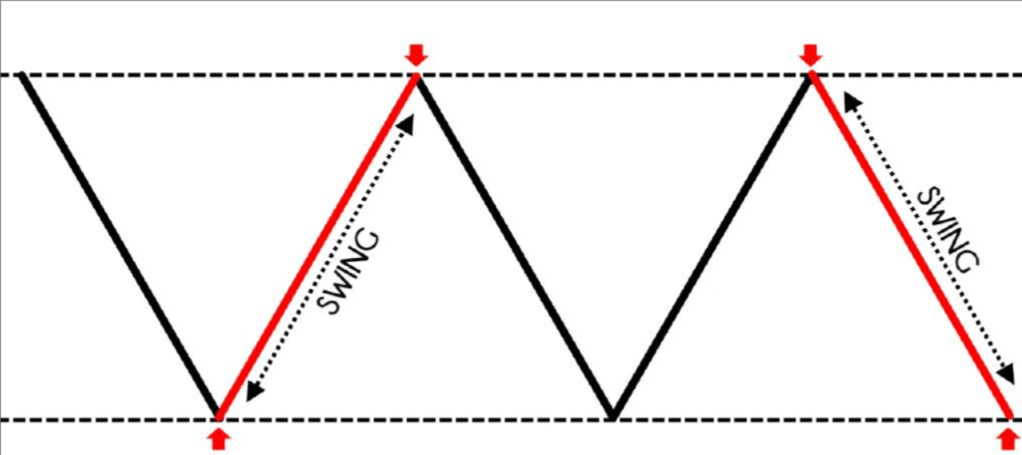
So, if you’re the type of person who wants to catch a trend or prefers a fixed target trader…
Then swing trading might be for you.
On the other hand, if you are the type of trader who wants to capture long-term trends and likes to trail your stops…
Then trend following might be for you.
That being said, there is no "best" trading method in the world, but there is a trading method that is best for you.
So, you might ask: How do you know the best?
Of course, this takes a lot of trying!
Only when you know what you don’t want can you know what you really want!
It takes time and effort, but that’s what trading is all about – a journey.
2. Trading Setup
Whether you use indicators or other tools to enter trades, it generally comes down to just these two:
Callback settings
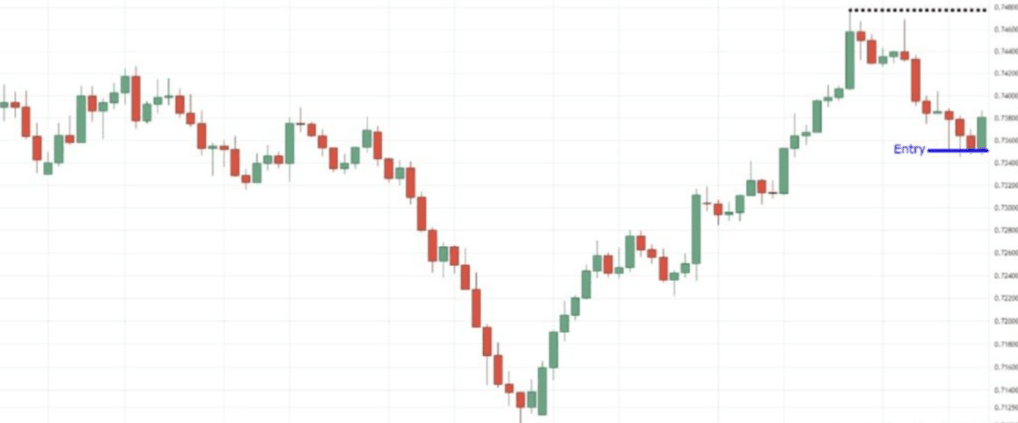
Breakout Setup
Trading breakouts means you are looking for confirmation.
breakthrough:
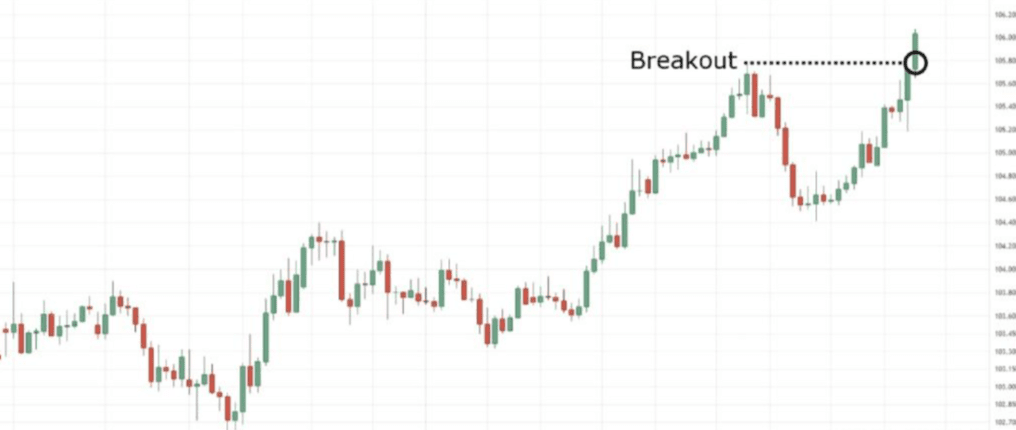
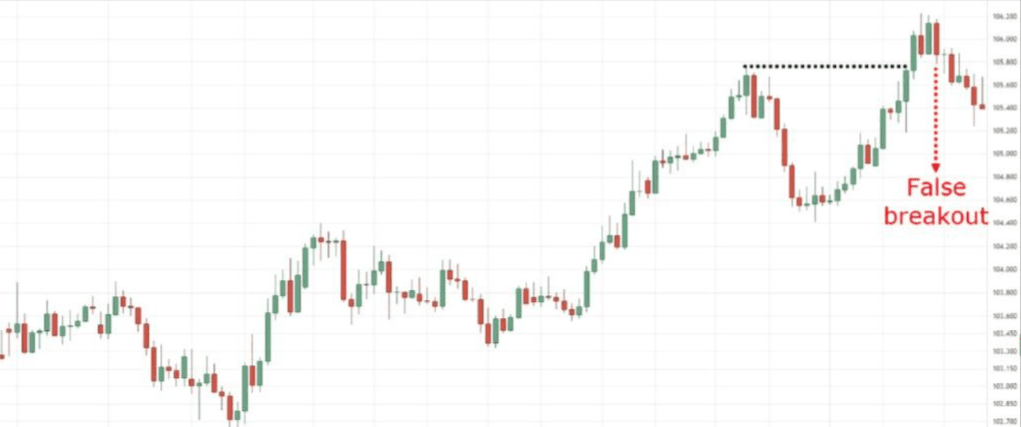
However, the downside is that it could turn out to be a “false breakout.”
False breakout:
And also, how you want the risk-reward ratio to be more flexible.
Poor risk-reward ratio breakout setup:
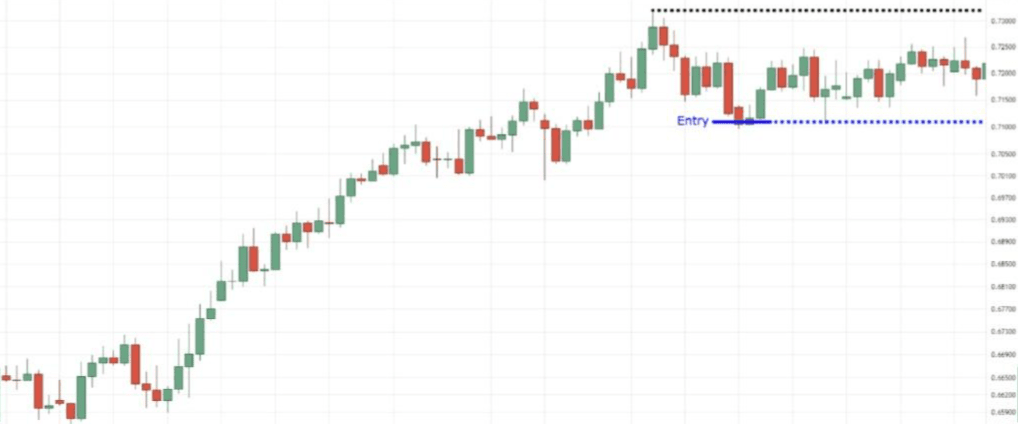
On the other hand, buying on a pullback means you wait for the right price to appear before entering the trade.
It's like waiting for gas prices to drop before filling up your tank!
Callback settings:
But then again, the downside is that the pullback you enter may not move for a long time, and the price may be trapped in a range-bound trend.
Long-term callback settings:
Even worse, there’s also a chance that the pullback could turn against you almost instantly!
Callback setup failed:
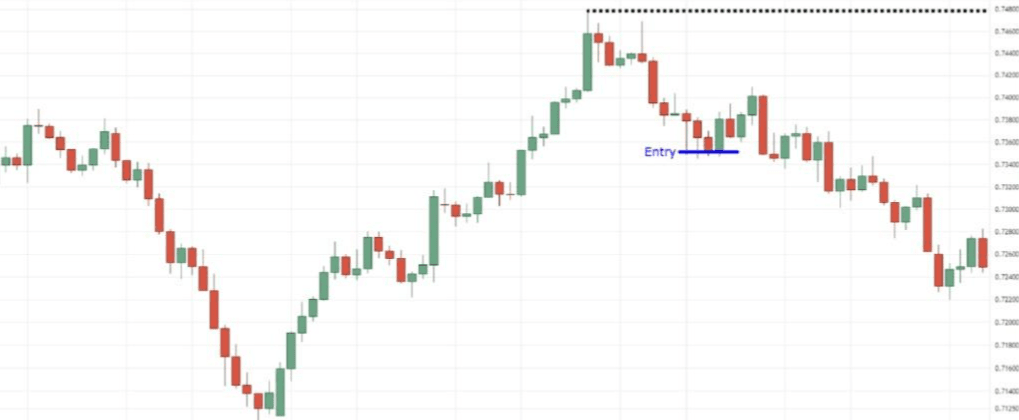
By now you should have noticed that I have not only shown you the advantages but also the disadvantages.
No single strategy or chart pattern works all the time!
Therefore, you should weigh these pros and cons before deciding which trade setup to use.
3. Transaction Management
Determining how to use a bullish candlestick pattern as an entry will depend on your trade setup.
For example:
If you are trading breakouts, you need to make sure that the candlestick at the time of the breakout is bullish relative to the previous candlestick.
Strong breakthrough:
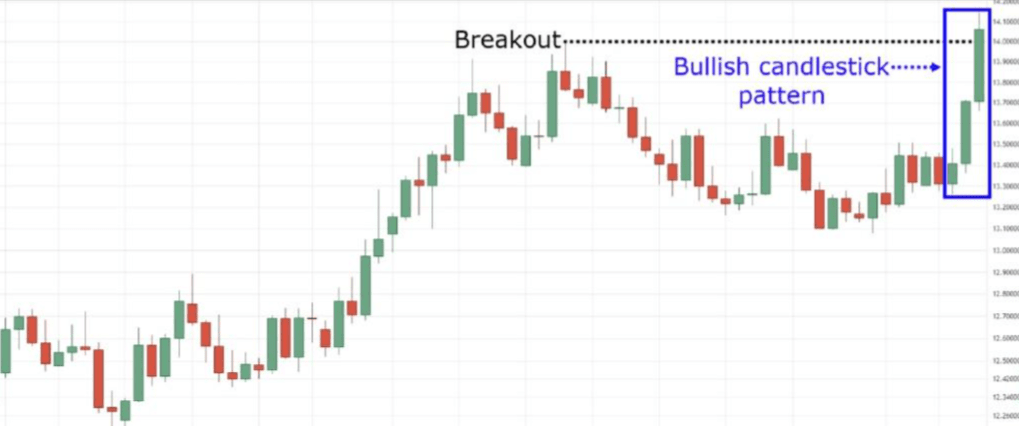
You could say that the candlesticks in the image above are a variation of the “Three White Soldiers” candlestick pattern. But the main point here is that the third breakout candlestick stands out more than the others!
If you are trading pullbacks, this concept cannot be more important.
Because if you are willing to take a trade at a low, hope for a bullish candlestick pattern to appear before taking the trade.
Callback settings:
Now on stage.
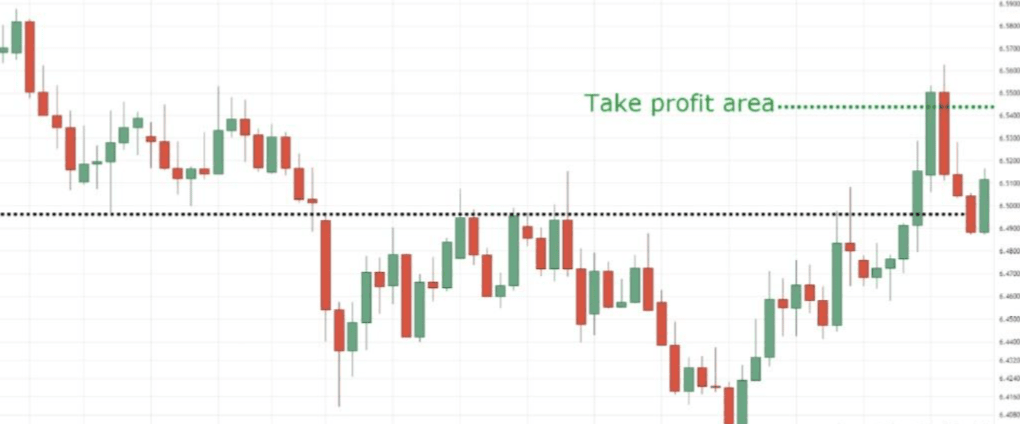
The key here is that how you exit a trade should depend on your chosen trading style.
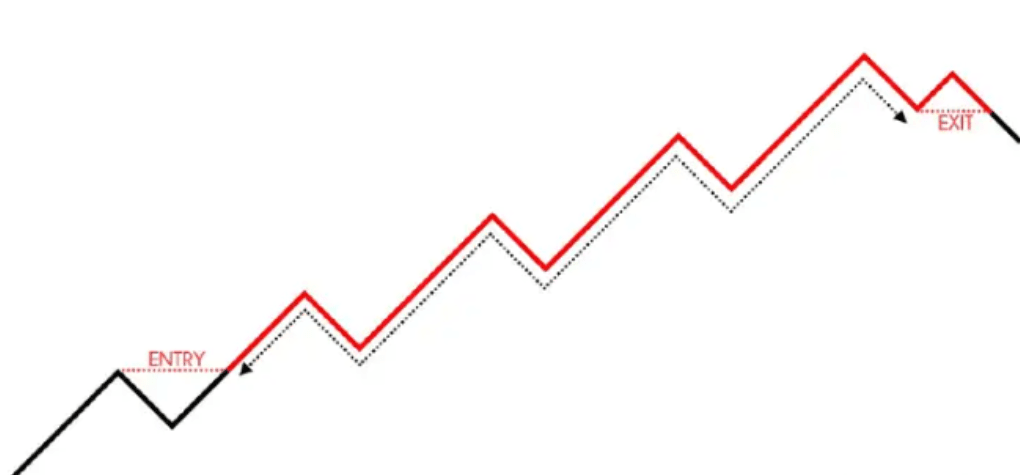
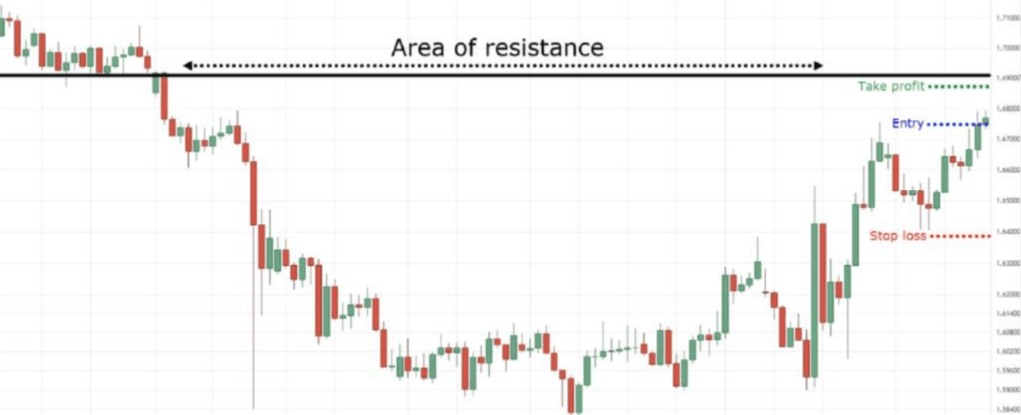
Therefore, if you are a swing trader, consider taking profits before the resistance area.
Swing trading setup:
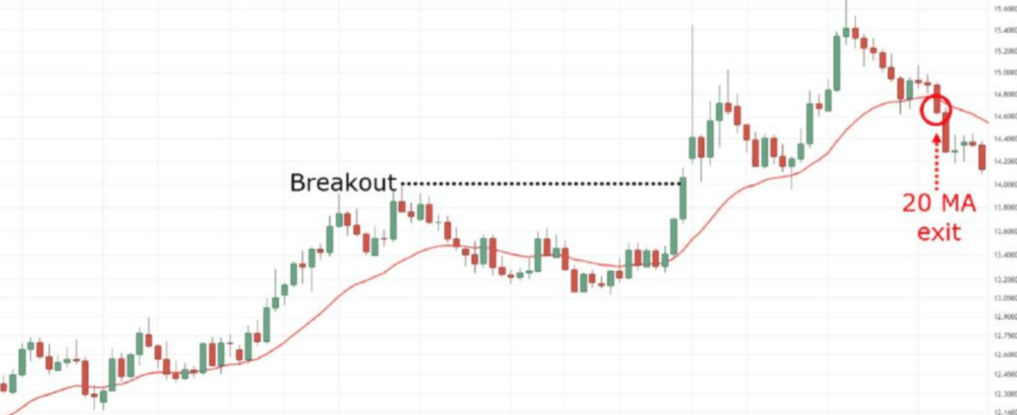
As a trend follower, using a trailing stop is more important than taking a fixed target profit.
Trend Following Settings:
I know of no bullish candlestick patterns.
But it wouldn’t be fair if I taught you how to enter a trade but not how to exit it, right?
Nevertheless, the conclusion is this:
The bullish candlestick pattern should never be traded in isolation as the bullish candlestick pattern is not a complete strategy on its own.
Summarize
Bullish candlestick patterns are essentially chart patterns on the lower time frames and can be irregular at times.
Additionally, the bullish candlestick pattern is a powerful tool to use when entering a trade because it puts you on the right side of momentum.
However…bullish candlestick patterns should not be used in isolation and must be used in conjunction with other factors such as price action.
That being said, I'd like to hear your thoughts.
How do you trade bullish candlestick patterns in a particular market?
Have you used them successfully in your trading in the past?
Finally, Shanyuan will share with you the 9 rules of mastering the cryptocurrency circle and becoming a cryptocurrency millionaire!
1. Liquidity Management Principles: It is recommended to use only disposable funds to participate in crypto asset investment, strictly avoid entering the market through leveraged financing or credit funds, and maintain the health of personal balance sheets.
2. Value Discovery Strategy: Establish a systematic project evaluation framework, focus on exploring high-quality projects with practical application scenarios, technical reserves and compliance qualifications, and build a multi-level asset allocation model.
3. Grid Position Building Mechanism: Implement a dynamic position building plan within the target asset price range, smooth the holding costs through phased investments, and cope with the short-term callback risks caused by market fluctuations.
4. Risk hedging portfolio adopts a cross-chain and cross-track diversified investment strategy, controls the upper limit of a single target position, and uses the low correlation between assets to build a risk hedging matrix.
5. Build information advantages: Establish a multi-dimensional information monitoring system, covering on-chain data analysis, regulatory policy interpretation and market sentiment monitoring, to form an information moat for investment decisions.
6. Trend tracking rule: Identify the market trend direction through technical indicators and fundamental analysis, avoid premature counter-trend layout when the trend is not clear, and keep the operation direction consistent with the mainstream capital flow.
7. Leverage Boundary Control: Strictly adhere to leverage discipline in derivatives trading. It is recommended to control the leverage ratio within a reasonable range (20-50 times) and set a forced liquidation line to prevent extreme risks.
8. Disciplined position management: Establish an investment discipline scorecard, proactively reduce position exposure when uncertainty increases, and regularly rebalance the portfolio to avoid excessive trading that could lead to loss of returns.
9. Behavioral risk management: Develop a quantitative investment decision-making process, clarify stop-profit and stop-loss standards, overcome human weaknesses through programmed operations, and cultivate an anti-fragile investment mentality.
To put it bluntly, playing in the cryptocurrency world is a battle between retail investors and market makers. If you don't have cutting-edge information and first-hand data, you will only be exploited! If you want to join forces and harvest the market makers together, please come to me <阿文加密 (Awen Crypto) Welcome like-minded cryptocurrency enthusiasts to discuss together~
There is a saying that I strongly agree with: the boundaries of knowledge determine the boundaries of wealth, and people can only earn wealth within the boundaries of their knowledge.
You must have a good mentality when trading cryptocurrencies. Don't let your blood pressure soar when there is a big drop, and don't get carried away when there is a big rise. It is more important to lock in your profits.
For people who don’t have many resources, being down-to-earth is the irrefutable way of survival.
Giving roses to others will leave a lingering fragrance on your hands. Thank you for your likes and attention! I wish you all financial freedom in 2025!


