
As of the time of writing, the price of Dogecoin (DOGE) reached $0.20, dropping over 3% in the past 24 hours and a cumulative decline of 10% in the past week, with daily trading volume at $1.4 billion. Previously, the token retreated after reaching a high of $0.28.
According to data, the total trading volume of Dogecoin in the past 24 hours reached $5.19 billion (up 54%), with open contracts at $3.09 billion; options trading volume was $17 million (up 30%), and open contracts at $120,000 (up 13%). The open contract volume for futures decreased from 19.7 billion to 15.36 billion during the decline, indicating a reduction in leveraged positions.
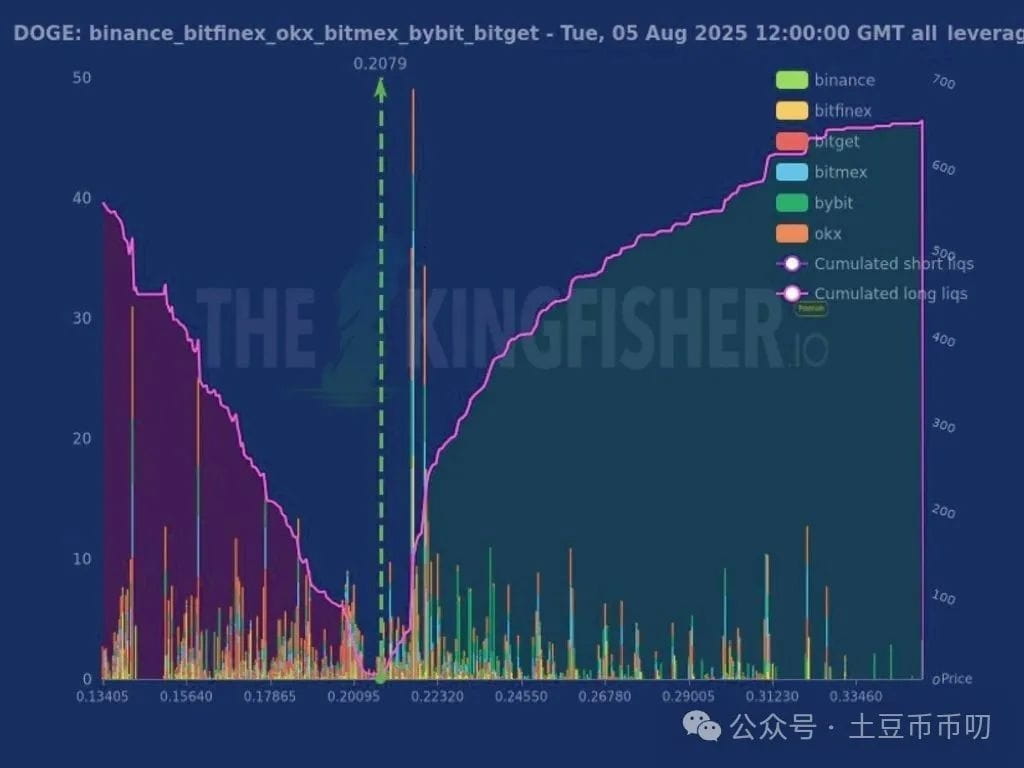
The largest short liquidation cluster is located near $0.208; if the price falls into this area, it may trigger a short squeeze; long liquidations are scattered, resulting in relatively low downward pressure. However, these liquidation levels are based on full leverage data and may take weeks to reach, tracking clusters can help predict forced liquidation positions and price fluctuation ranges.
The current price of Dogecoin is showing a new round of downward trend, underperforming Bitcoin and Ethereum:
Falling from the resistance level of $0.2120, breaking below the support levels of $0.2050 and $0.20, and currently below the 50% Fibonacci retracement level of the upward trend between $0.1886 and $0.2112, shorts have pushed the price below $0.1980.
The hourly chart shows the formation of a key descending channel, with the resistance level at $0.20; the price is currently below $0.1980 and the 100-hour simple moving average.
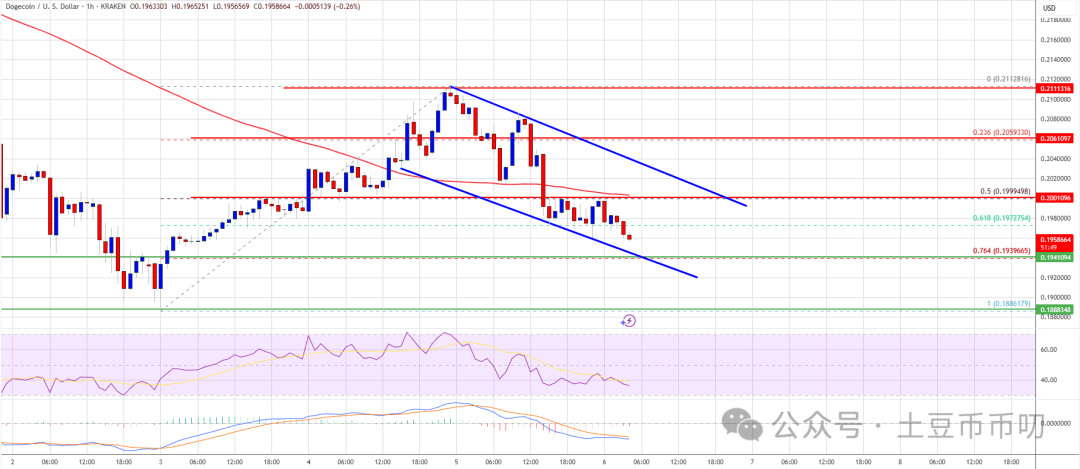
On the upside, the immediate resistance level is around $0.20, with the first major resistance level at $0.2050 and the next key resistance level at $0.2120; if the closing price breaks above $0.2120, it may further rise to $0.2250 and $0.2350, with the main stop-loss level for longs at $0.250.
On the downside, if it fails to break above $0.2050, a new wave of decline may begin: the initial support level is at $0.1940 (corresponding to the 76.4% Fibonacci retracement level of the upward trend between $0.1886 and $0.2112), the next major support level is at $0.1880, and the key support level is at $0.1750; if it breaks below $0.1750, it may drop to $0.1680 or even $0.1620 in the short term.
Technical indicators show: the hourly MACD is gaining momentum in the bearish zone, RSI is below the 50 level; major support levels are at $0.1940 and $0.1880, while major resistance levels are at $0.2000 and $0.2050.


