Are there still remnants of bulls in the market? Firmly trend corrections, do not go long.
Yesterday, I also advised to set up short positions at the 3660-3680 level, which has directly turned profitable. Currently, I am watching the support at the 3550 level below and seeing how long it can hold. Once it breaks, we will directly look at our target (mentioned in previous articles).
The short position at 114800 for Bitcoin also directly hit the target. Look at trend trading, and everyone can easily make gains.
It is now 12:30 PM, and the overall price is still in a downward trend. Everyone should focus on short positions and not go long, not go long, not go long.
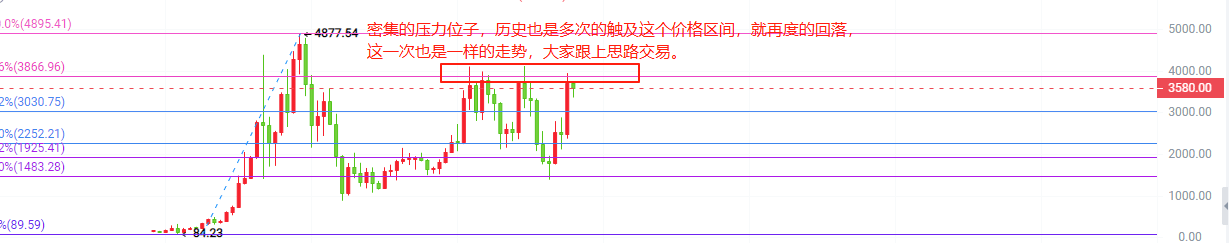
From a monthly perspective, the overall trend is still under pressure and falling. I have emphasized multiple times in articles that historically, whenever the price touches the resistance levels, it has always fallen back, and this time is no exception. Follow the trend, it’s simple and straightforward.
As long as Ethereum does not effectively break the 3755-3775 level above, it is our short position high point. Everyone can operate directly. The dense resistance levels above make it hard to find so-called bullish momentum in the market.
Bitcoin has also been mentioned in my previous articles. Although it is not at a historical high, the strong resistance at 120k still exists. Following the last high of 110k, it showed a single needle top candlestick pattern, then fell back to around 80k. Looking at the current price trend, the 120k level also shows a single needle top pattern. Currently, it is already trending down. Once this trend forms, the historical high for this year will be the 120k level.
Everyone should follow Wu Yang's thinking to operate, first determine the larger trend, and then look for precise points to set up positions, which will yield twice the result with half the effort.
The price trend seen on the weekly chart:
Ethereum has already formed a dark cloud cover pattern as mentioned in my previous article, which indicates a pullback ahead. Although we currently see a bullish candlestick trend, it is still slowly falling. Once the support at 3550 breaks, it will directly lead to a waterfall trend, with support levels below at 3525-3325-3255.
Bitcoin has already broken the dark cloud cover pattern last week. This Monday, Wu Yang continued to expect a pullback, but the short-term rebound gave some confidence to the bulls, resulting in a merciless slap in the face for them. Looking at the indicators in the attached chart, everything is in the overbought territory. Once the price moves, 120k will be this year's high. The pullback strength is seen at the price levels of 100k-90k. This means there is still a pullback space of 10k-20k, which everyone can manage themselves.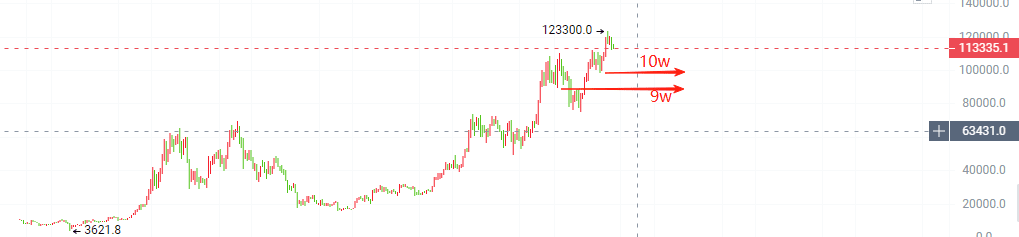
On the daily chart, it’s simple and clear, trade with the big trend.
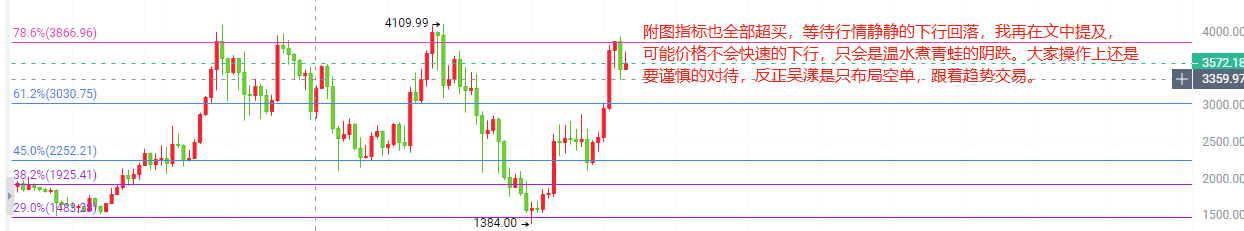
Although there was a nice rebound on Monday for Ethereum, Wu Yang also mentioned in the article that it is merely a rebound to correct the price trend. The market is not in a one-way downward trend; there is time for correction. Over the past two days, the price has returned to the downward trend. The resistance level of 3755-3775 mentioned multiple times in the article can be clearly observed on the daily chart.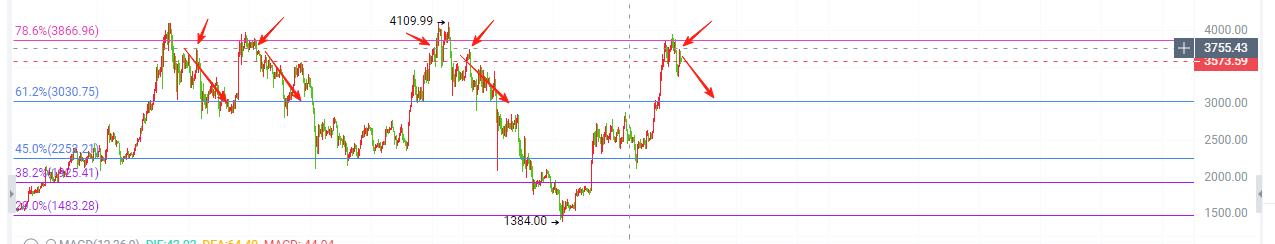
The Bitcoin trend is relatively weak, with the price at the previously suggested support level of 112222. Wu Yang firmly sees a downward trend. This 112222 level has been given in previous articles, and if the price continues to move down to this level, it will directly reach the 100k range. Everyone should focus on this level in their operations.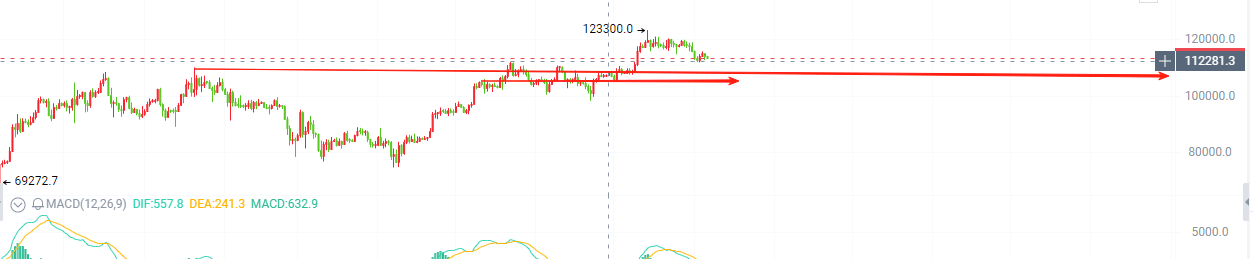
On operations
For Bitcoin, any point around 114000 can set up short positions, and if there is a slight rebound, go short at 115000. The stop loss can be set at 500 points, with the target looking down at 112222-110500-108222.
Ethereum can go short at 3650-3670, with a stop loss of 30 points. The target is to refer to the target points given in the article.