
In the CryptoQuant Quicktake post, an analyst discussed the trend of capital inflow into altcoin exchanges on Binance. The key metric here is 'Exchange Inflow Transaction Count', which, as the name suggests, measures the total number of deposit transactions that investors make on a specific centralized exchange. Below is the indicator chart showing the trend of altcoin deposits occurring on various exchanges.
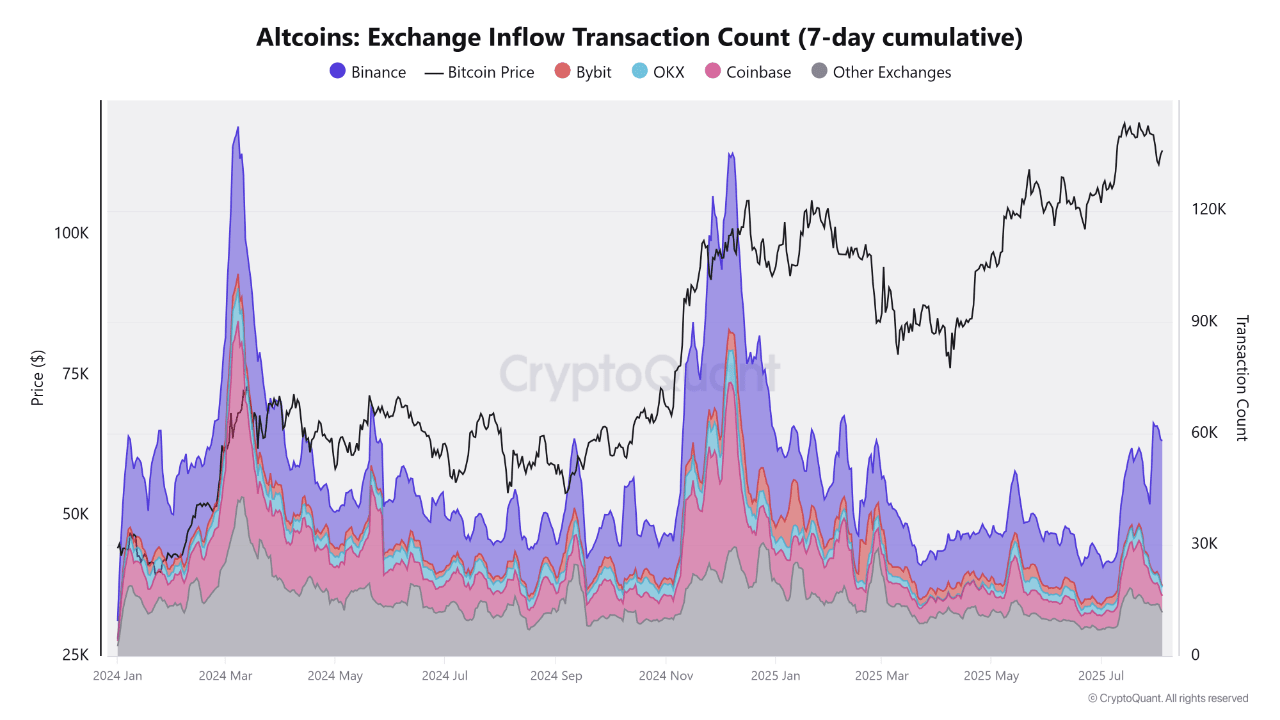
As can be seen in the chart, the number of inflow transactions of altcoin exchanges peaked across all exchanges just before both market peaks in 2024, implying that deposit activity has strengthened on these platforms. Typically, investors transfer their funds to exchanges when they want to sell, so a spike in inflow to exchanges can lead to downward price action. This seems to be what happened in these two cases.
Interestingly, during the most recent market downturn that occurred over the past few days, the inflow of capital spiked on just one exchange: Binance. There have been previous instances where this pattern developed. 'Capital inflow spikes into Binance (represented by the purple area) often occur before price declines or market corrections,' the analyst noted.
Quant also explained that Binance is not only the largest exchange in the industry by trading volume but also a hub for altcoin activity from both retail and institutional investors. Therefore, investor behavior on this platform can be quite relevant to the broader market.
Speaking of altcoins, CryptoQuant has shared a few new indicators that can be used to track smart money inflow. One of them is Average Order Size, which distinguishes future buy orders by their scale.
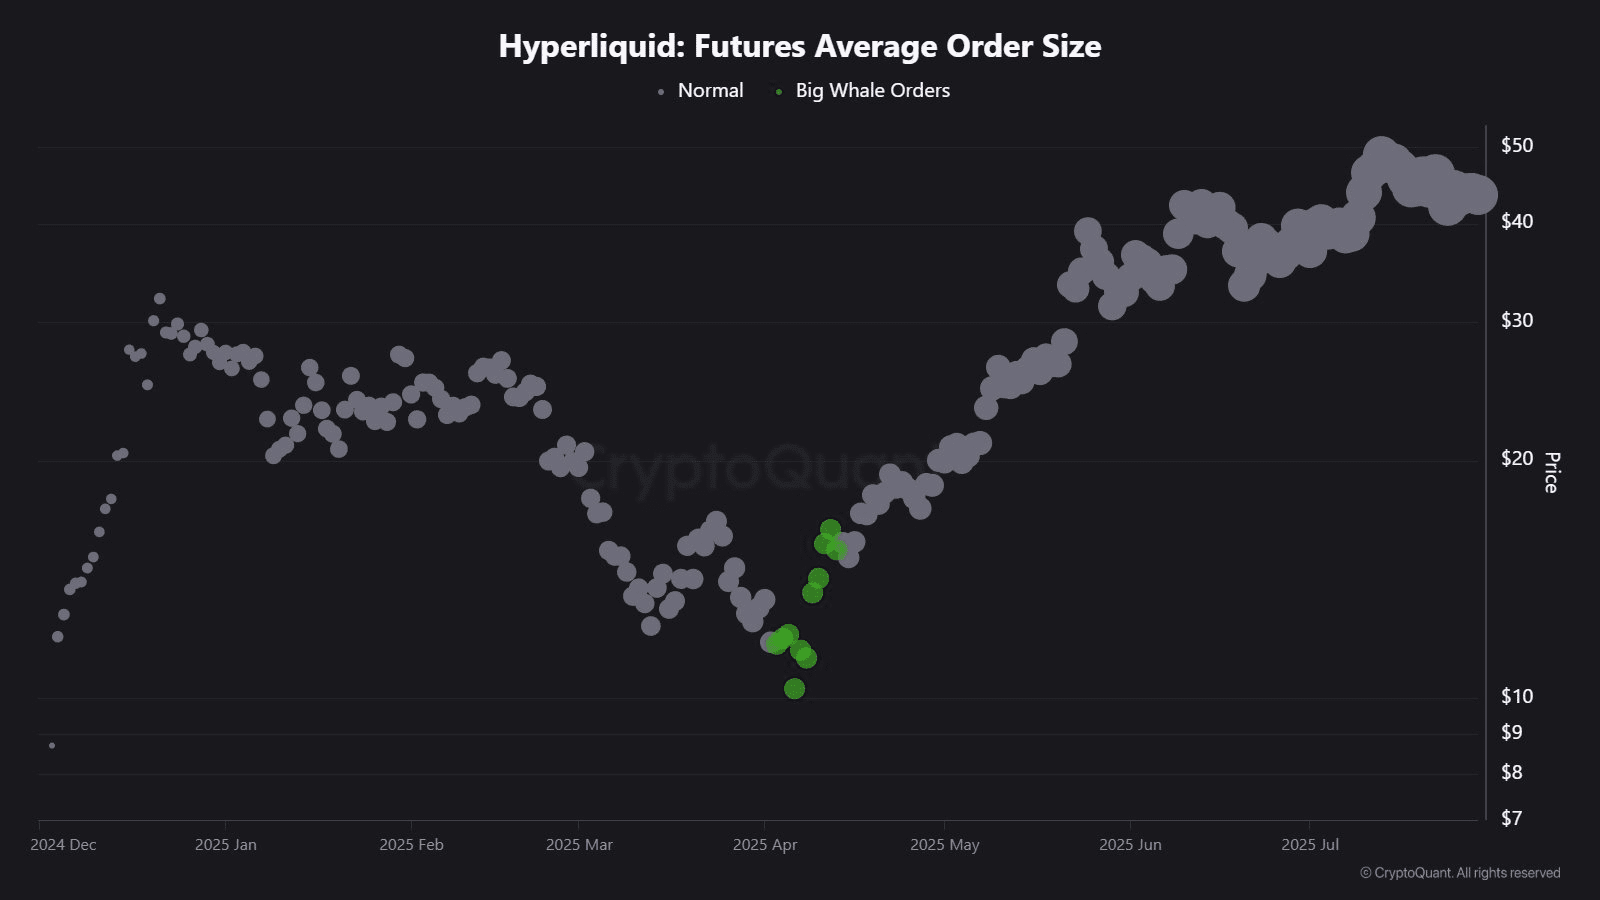
The chart above shows the data of the Hyperliquid (HYPE) indicator. It appears that large buy orders emerged when this altcoin was trading at around $11 at the beginning of the year. Since then, the price has risen to $39.
Another indicator is Retail Activity Through Trading Frequency. This indicator is the opposite: it indicates periods of strong activity from retail investors.
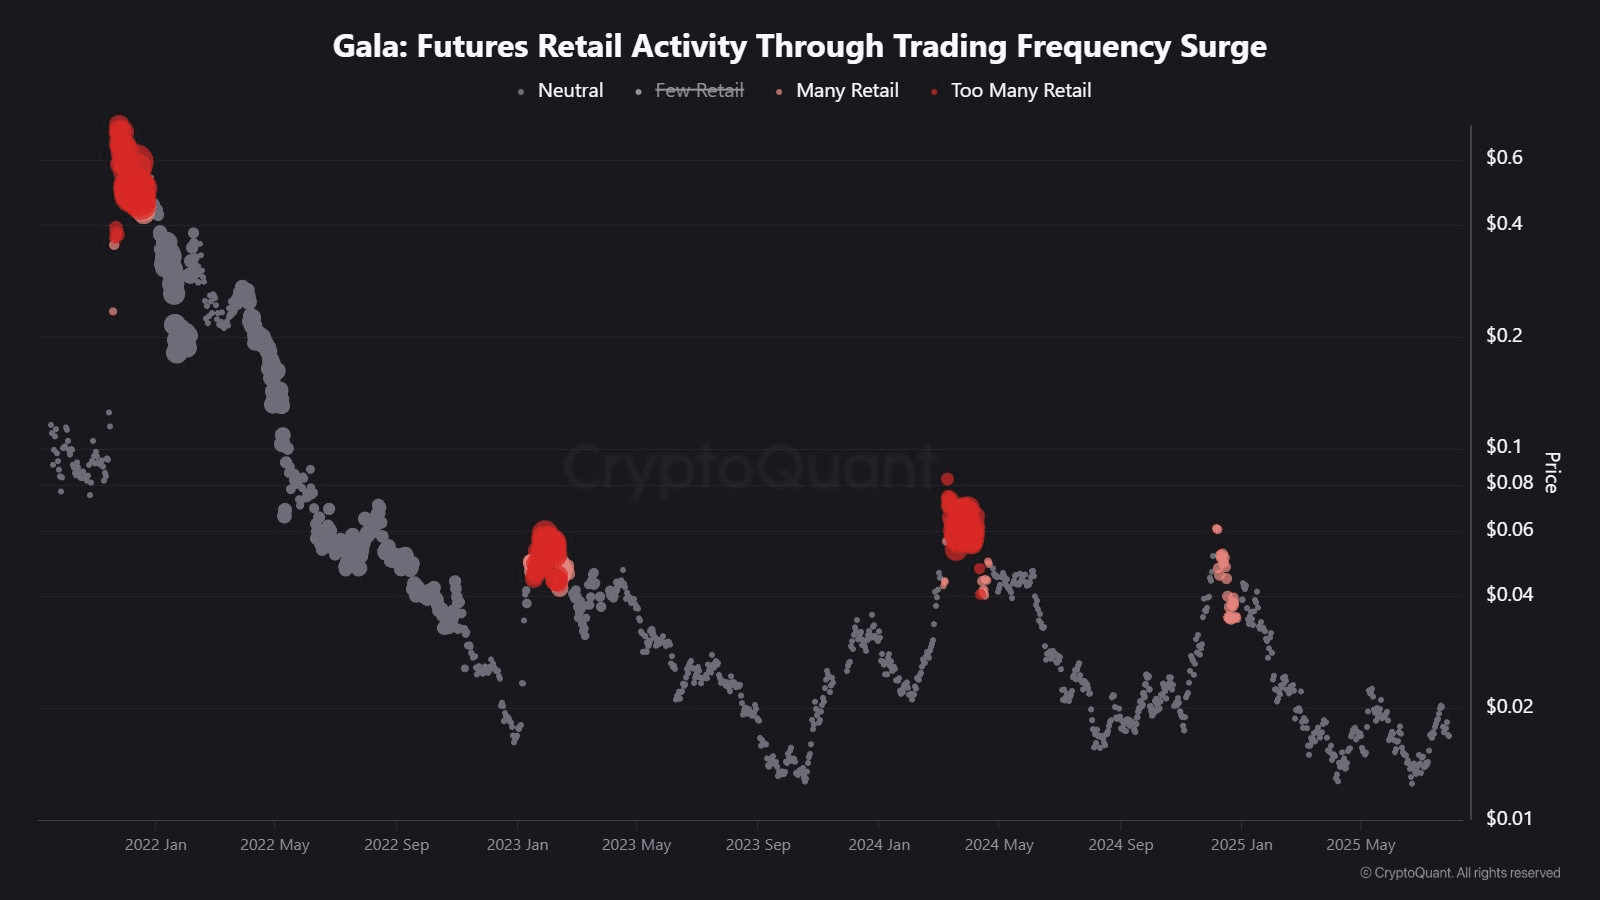
From this chart, it is clear that the period of high retail interest coincided with the time when Gala (GALA) stock price reached its peak.