How to See the Market Through Institutional Eyes and Understand Where Smart Money Moves?
First: What is Volume Profile?:
Volume Profile is an advanced technical analysis tool that shows you the amount of trading that occurred at each price level—not within each time-based candle like traditional volume.
In other words, it’s a horizontal map that reveals where the market was most active in trading contracts, highlighting zones of accumulation by large buyers and sellers, also known as “Smart Money.”
Why is it a Powerful Tool?:
Because price alone doesn’t tell the whole story. You might see a strong rally, but without knowing the volume behind it, you can’t judge whether it’s real or fake.
Volume Profile reveals whether moves are backed by strong liquidity, and it highlights areas of “fair value” where prices tend to return.
Key Concepts:
Point of Control – POC:
This is the price level where the highest trading volume occurred. It represents the balance point between buyers and sellers and is often revisited by price after deviation.
Value Area – VA:
This area contains approximately 70% of the total traded volume. It consists of an upper boundary called VAH (Value Area High) and a lower boundary called VAL (Value Area Low).
If price is within this range, it suggests the market is in equilibrium. If it breaks out, it could signal the start of a new directional move.
High Volume Node – HVN:
A price area where a large number of contracts were traded, indicating strong market interest at those levels.
Low Volume Node – LVN:
An area with low liquidity that price often moves through quickly due to lack of trading interest. These are considered weak spots in the market.
How to Use Volume Profile in Practice:
If price approaches the VAL, it could be a buying opportunity if support is present.
If it nears the VAH, it could be a selling opportunity if selling pressure appears.
When price breaks out of the value area and continues with strength, it may indicate the beginning of a new trend.
It’s also essential to monitor how price reacts to the POC. If price returns to it after a strong move, it may be a sign the market is attempting to rebalance.
Types of Volume Profile:
Fixed Range: Applied to a custom time range you select, such as a specific week or trading session.
Session Profile: Automatically plotted for each day or session, often used by intraday traders.
Composite Profile: Covers longer periods like weeks or months, revealing major support and resistance zones.
BTC Practical Example:
Imagine Bitcoin is currently trading at $58,000.
The Volume Profile analysis shows:
POC at $57,200 – the level price may return to if the trend weakens.
VAH at $57,800 and VAL at $56,900 – the boundaries of fair value.
LVN at $56,600 – a low-volume area that could lead to a sharp drop if price breaks down quickly.
In this case, if price breaks above VAH with high volume, it could be a strong bullish signal.
If there’s no supporting volume, the move might be fake and price could revert to the POC.
Pro Tips:
Don’t use Volume Profile alone. Combining it with other tools like candlesticks, trend lines, or ICT tools like the Fair Value Gap gives you a much clearer picture.
Watch how the POC shifts over time—it reveals where the market’s interest is moving.
If there’s an LVN below current price, any drop could be swift and unbalanced.
Price interaction with the POC often provides an excellent opportunity to watch for potential reversals.
Conclusion:
Volume Profile is an invaluable tool for the smart trader. It gives you deep insight into market activity, reveals where smart money is moving, and highlights levels truly worth your attention.
Instead of chasing price, you’ll be able to anticipate it by understanding the volume behavior happening behind the scenes.
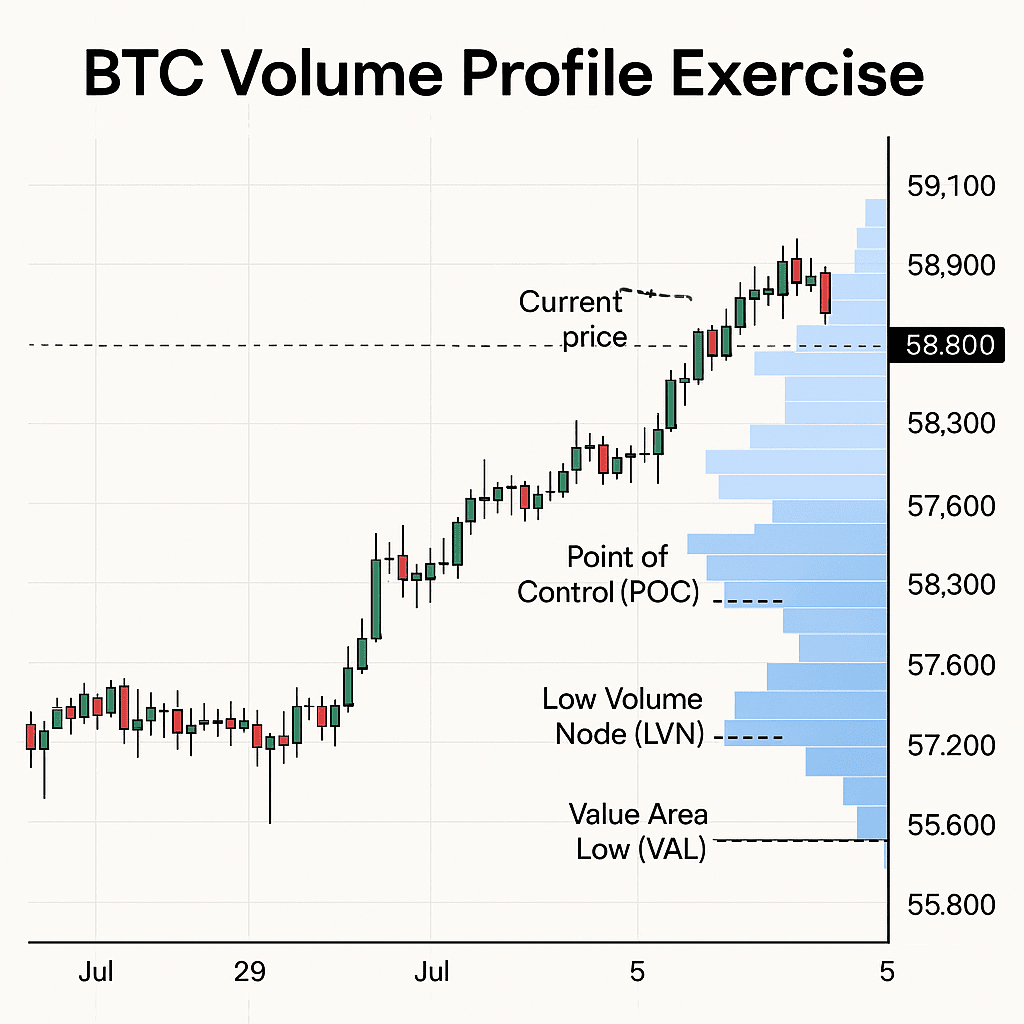
📊 BTC Volume Profile Exercise:
Use Volume Profile to identify key trading zones, and determine whether to buy, sell, or wait based on price interaction with high/low volume nodes, value area, and point of control.
🧪 Chart Setup:
Asset: Bitcoin (BTC/USDT).
Timeframe: 1H (Hourly).
Indicator: Fixed Range Volume Profile.
Range: From July 29th to August 5th.
Use TradingView or any charting platform that supports Volume Profile tools.
🧩 Observations (based on the chart):
Let’s assume the following levels were found after applying the Volume Profile:
POC (Point of Control) = $58,300
Value Area High (VAH) = $59,100
Value Area Low (VAL) = $57,600
Current Price = $58,900
There’s a visible Low Volume Node (LVN) around $58,000
Price previously bounced from $57,600 (strong support)
📝 Your Tasks:
1. Where is the current price in relation to the value area?
Is it inside, near the edge, or breaking out?
2. Is price approaching a High Volume Node or LVN?
What could that suggest about upcoming price action?
3. How has price reacted around POC in the past few hours?
Any rejections or consolidations?
4. Is the breakout above VAH supported by strong volume?
If yes, what does it indicate?
5. Would you consider entering a long, short, or stay out?
Justify your answer based on what you see.
✅ Example Analysis (Optional Help):
If price is currently above VAH with strong bullish candles and increasing volume, it might indicate a breakout attempt and a potential long setup.
However, if price is hovering around VAH with weak momentum and no clear push, it could be a false breakout, and price might return to POC or even VAL.
🎯 Final Question:
Based on your interpretation of the Volume Profile, what is your trade plan for BTC in the next few hours?
Long? Short? Target? Stop-loss? Entry zone?