In the world of crypto, patterns speak louder than words — and the $SPK
SPK/USDT chart is screaming opportunity. What we’re witnessing is a textbook bullish breakout, backed by strong volume and clean moving average support. Let's break it down:
📈 The Pattern:
The 15-minute chart showcases a beautiful ascending rally where price broke key resistance around $SPK 0.0908 and rallied all the way to 0.1279. Each retracement is being caught by the 7MA and 25MA — a clear signal of institutional or whale buying.
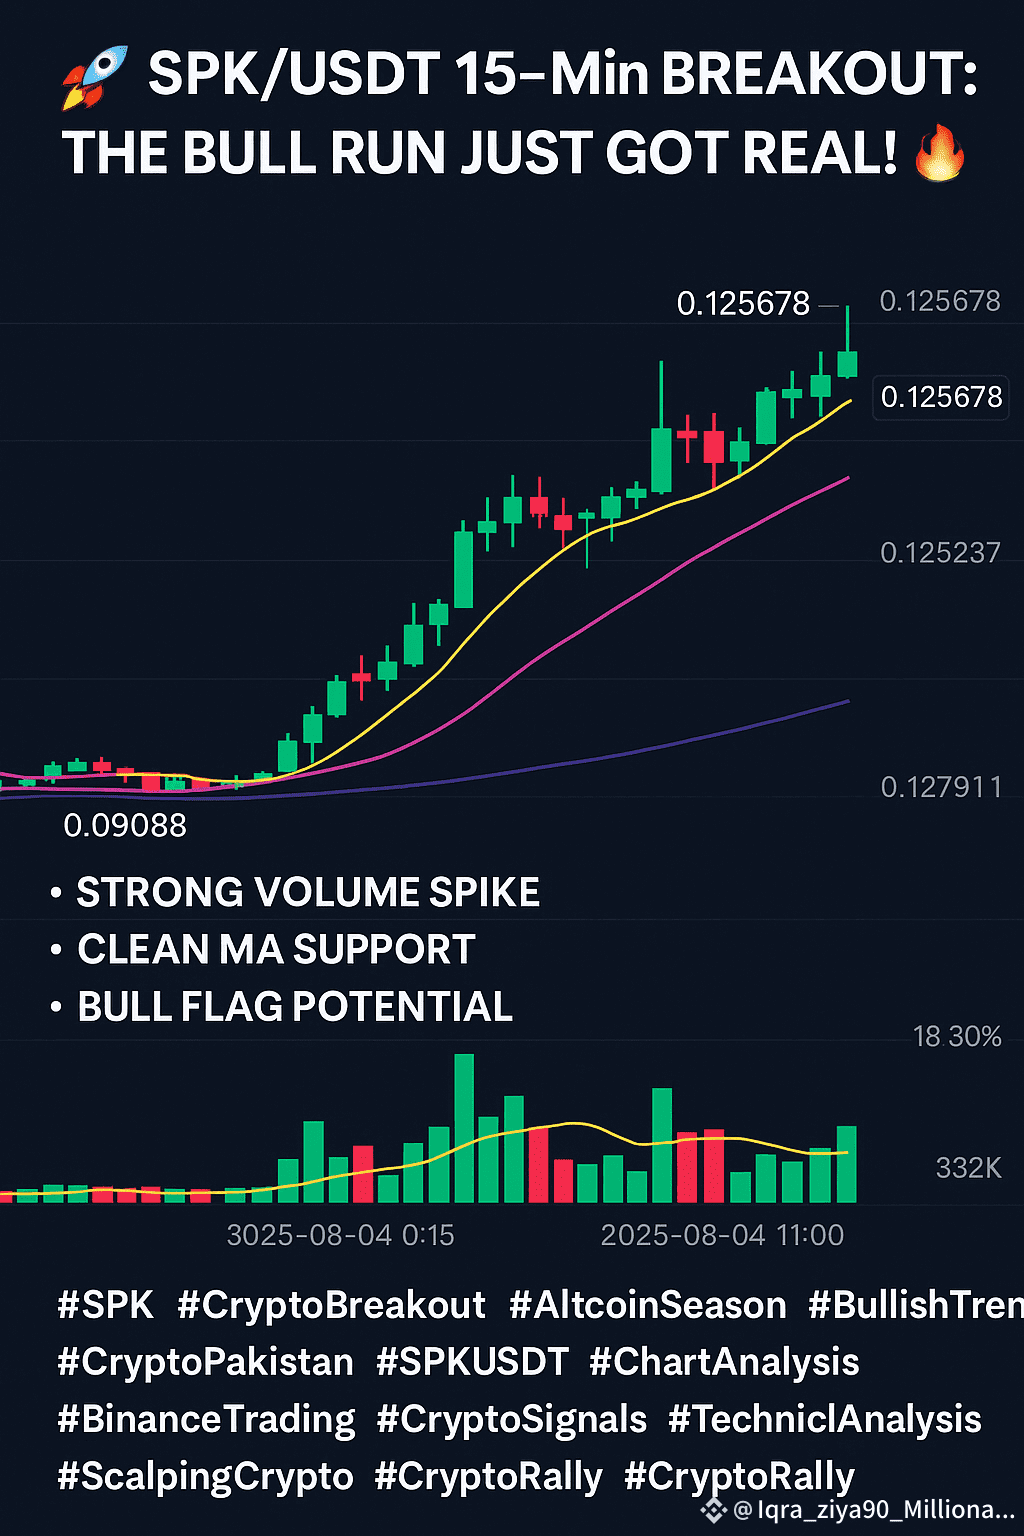
🔍 Key Observations:
Strong Volume Spike: Volume started increasing as price broke out, confirming buyer interest.
Clean MA Support: The yellow (MA7) and purple (MA25) lines are acting like price magnets — guiding the bullish trend upward.
Bull Flag Potential: Small consolidation before another potential breakout? Eyes on 0.1297 resistance.
💡 What It Means:
This pattern often precedes continuation moves, especially when supported by increasing volume and momentum. Traders might consider setting alerts near support levels for potential entry points.
⚠️ Reminder:
This is not financial advice. Always DYOR (Do Your Own Research) and use stop-loss strategies.
📢 Final Words:
If $SPK can hold above the 0.121 level and break 0.129 resistance, we could be looking at a potential moonshot in the next few sessions. Stay sharp!
#crypto #Binance #altcoins #cryptosignals #crypto2025