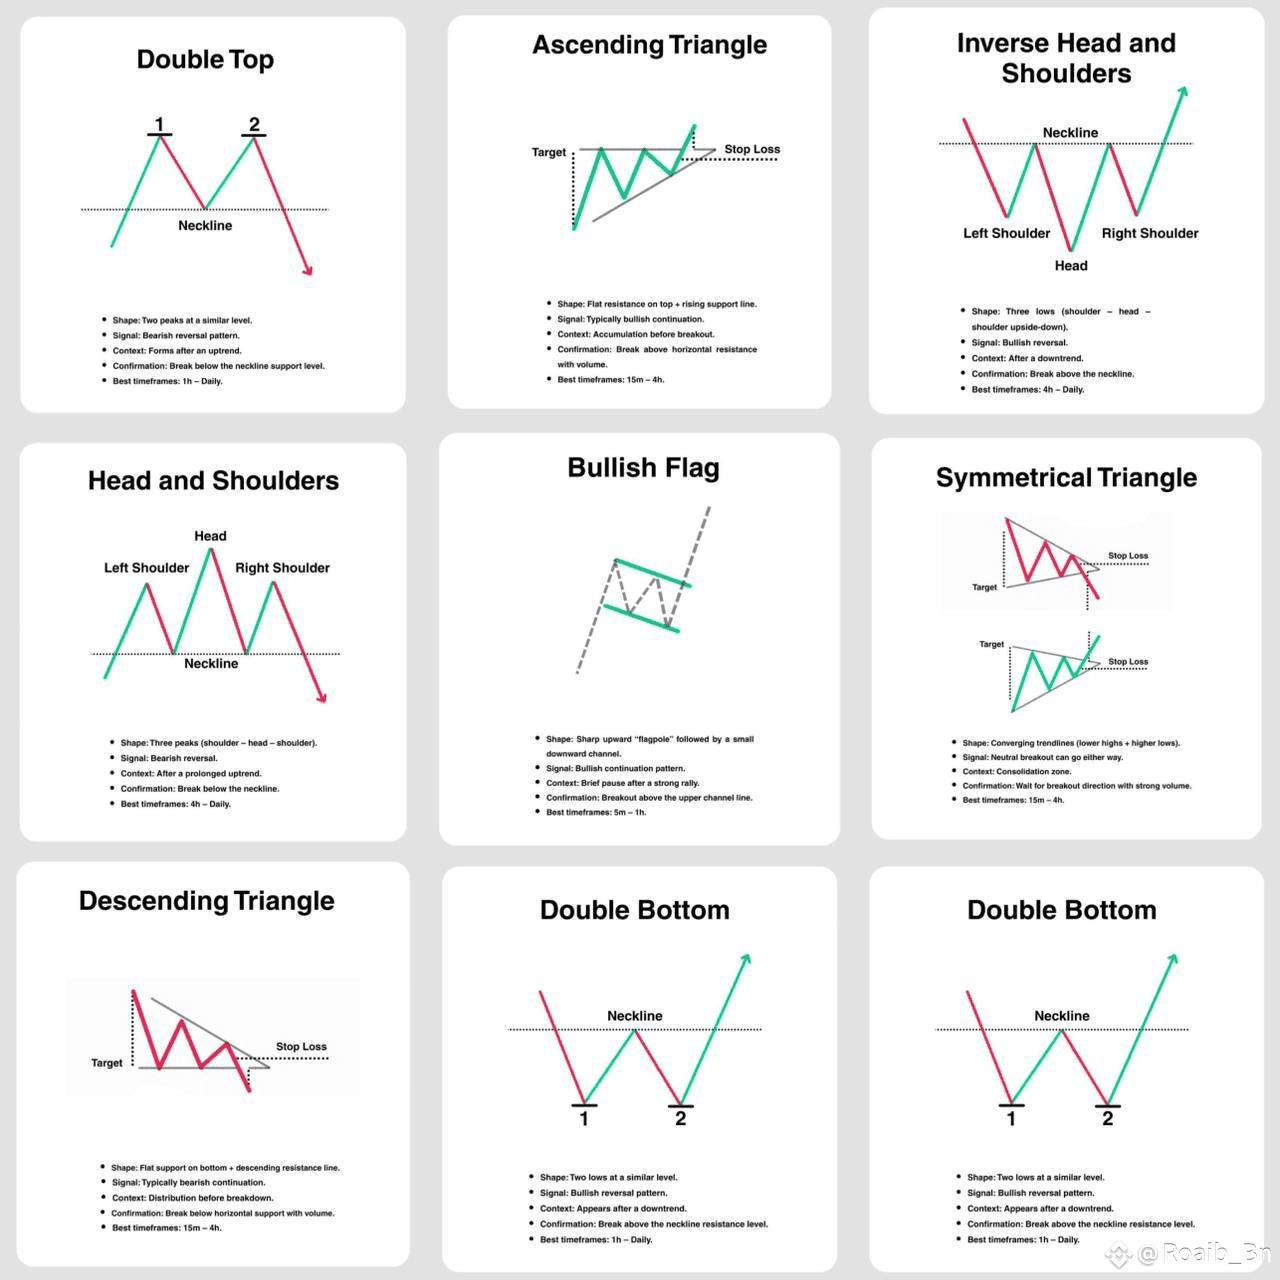
1️⃣ Double Top
Two peaks at a similar level followed by a breakdown.
📉 Bearish reversal — signals potential trend reversal from up to down.
🧠 Watch for: Break below the neckline for confirmation.
---
2️⃣ Ascending Triangle
📈 🔼 Flat resistance on top, rising support from below.
🚀 Bullish continuation pattern — price is getting squeezed toward breakout.
🎯 Target = height of the triangle added to the breakout level.
---
3️⃣ Inverse Head & Shoulders
👤 Shoulders down, head lower, second shoulder — reversed formation.
📈 Bullish reversal — signals a shift from downtrend to uptrend.
✅ Confirmation: Break above neckline.
---
4️⃣ Head & Shoulders
👤 Classic reversal — Left Shoulder, Head, Right Shoulder.
📉 Bearish signal — shows weakening bullish momentum.
🚨 Breakdown below neckline triggers sell pressure.
---
5️⃣ Bullish Flag
🚩 Small downward channel after a big rally.
🚀 Continuation pattern — a pause before another bullish run.
📌 Breaks upward with volume = strong momentum!
---
6️⃣ Symmetrical Triangle
🔻🔺 Price squeezes between lower highs and higher lows.
⏳ Neutral pattern — breakout direction matters.
📈 or 📉 Watch for a strong move + volume for confirmation.
---
7️⃣ Descending Triangle
🔻 Flat support, falling highs.
📉 Bearish continuation pattern.
💥 Breakdown below support = trend continuation.
---
8️⃣ & 9️⃣ Double Bottom
🔽🔽 Two bottoms at a similar level form a "W" shape.
📈 Bullish reversal — trend shifting from down to up.
📌 Breakout above neckline confirms upward move.
HERE is the candles image 👇
✨ Final Tip:
Patterns don’t work alone — combine them with volume, trendlines, and indicators like RSI or MACD for best results! 🧠🔍
❤️ Found this helpful?
Then Like 💬 Comment 🔁 Share & Follow for more trading alpha on #BinanceSquare
#BTCUnbound #CFTCCryptoSprint #BinanceHODLerPROVE #BitcoinTreasuryWatch #BTCReserveStrategy