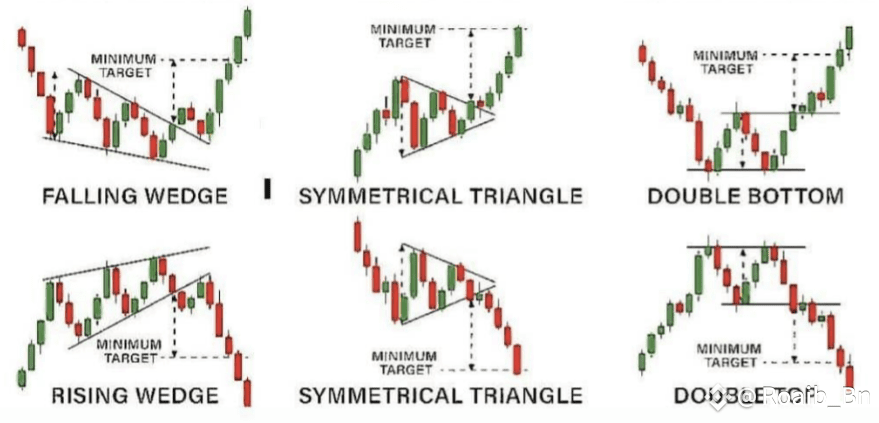
1️⃣ Falling Wedge ⬇️➡️⬆️ (Bullish)
Price compresses downward in a wedge.
Breakout upward signals bullish reversal.
Minimum target = wedge height.
---
2️⃣ Symmetrical Triangle 🔺 (Bullish)
Price consolidates forming equal triangle slopes.
Breakout in direction of trend (usually bullish).
---
3️⃣ Double Bottom 🐂
Two equal lows forming “W” pattern.
Breakout above neckline confirms bullish reversal.
---
4️⃣ Rising Wedge ⬆️➡️⬇️ (Bearish)
Price rises inside narrowing wedge.
Breakout downward = bearish reversal.
---
5️⃣ Symmetrical Triangle 🔻 (Bearish)
Appears during downtrend consolidation.
Breakout downward continues bearish trend.
---
6️⃣ Double Top 🐻
Two equal highs forming “M” pattern.
Breakout below neckline confirms bearish reversal.
---
Why These Patterns Matter?
Predict trend continuation or reversal
Plan better entry & exit points
Combine with volume for confirmation
---
Here is the chart image 👇
If you found this helpful, smash ❤️ and comment “PATTERNS” to learn more! 🚀
#BTCUnbound #CFTCCryptoSprint #BinanceHODLerTOWNS #BTCReserveStrategy #BinanceHODLerPROVE