25/08/05 BTC returns to a descending wedge, ETH rebounds under pressure at 3700. What will happen next?
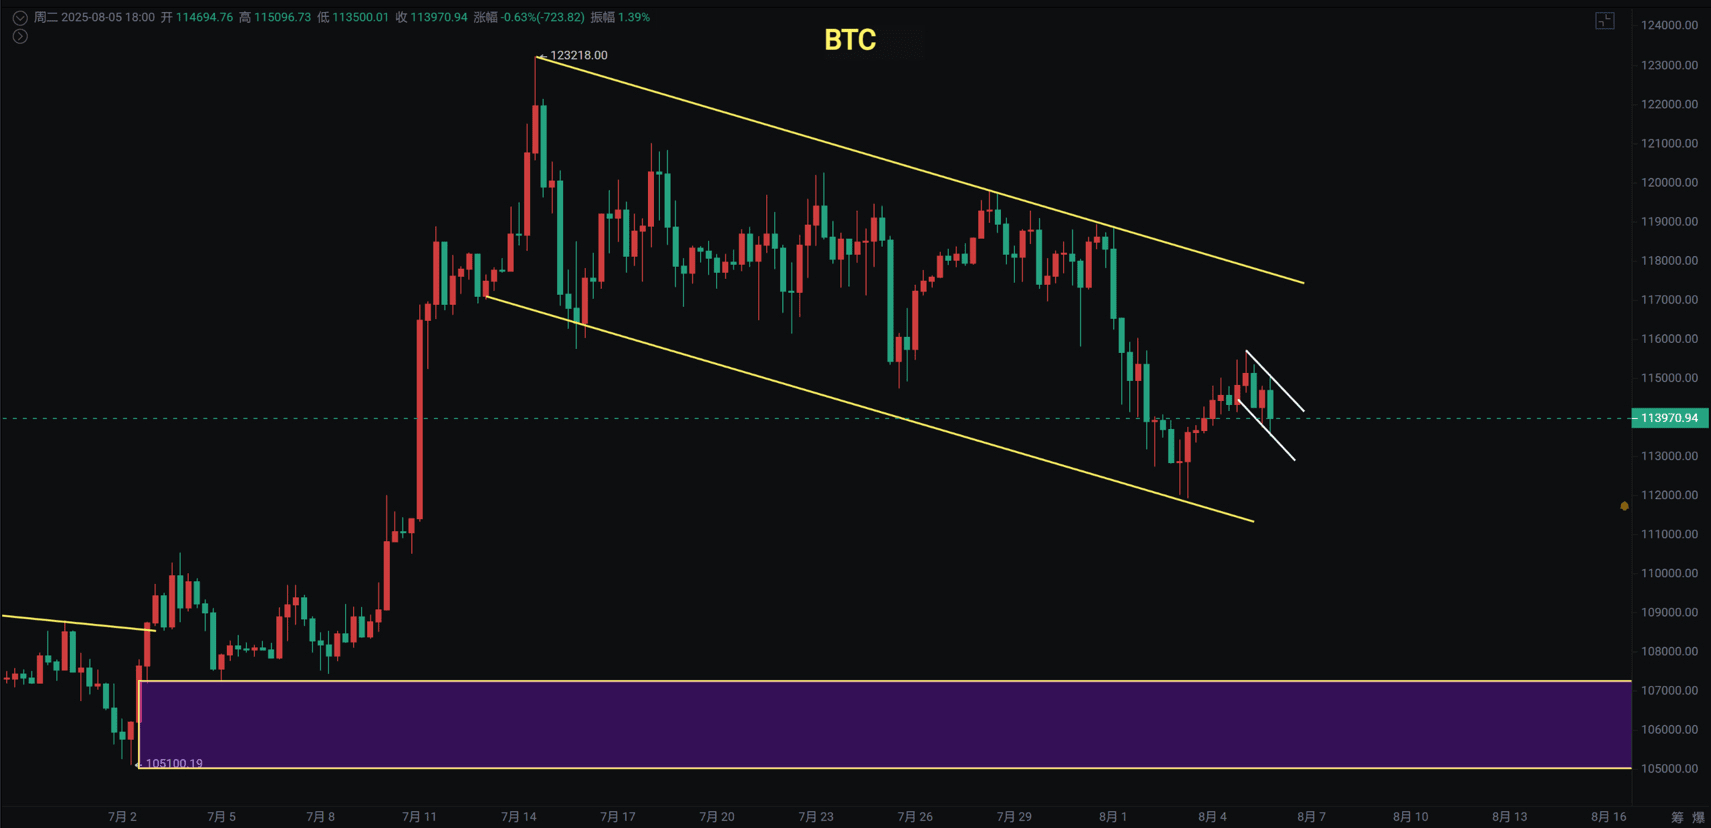
The daily chart of Bitcoin rebounded to 115713 and retreated, currently around 114700. This is the previous daily oscillation bottom with two supports that have not been broken, making the rebound relatively weak. However, the 4-hour descending wedge has recovered, so breaking through these two resistance levels is necessary for further upward movement.
Ethereum is under pressure below 3750 after rebounding. The 4-hour chart is under pressure from MA20 and MA60. The short-term entry point reminded on August 3rd at 9:30 AM saw nearly a 10-point gain, and the previous reminder for accumulating positions in batches when it dropped to 3350 was also very close. The daily pullback has not yet ended.
U.S. stocks broke through the previous high but had a significant drop last night, yet the rebound exceeded 1 point. Therefore, tonight's movement is crucial; as long as the short to medium-term pullback does not fall back below the previous high, the risk remains low.
Bitcoin
The monthly risk support is at 105000 and 107000; only a break below these two levels will result in a reversal. The weekly divergence situation is somewhat similar to 2020 and 2021, so there shouldn't be a continuous decline on the weekly chart. The daily upward trend has not been broken, and it has also formed a descending wedge and flag pattern. The MACD histogram has shortened in the past two days, and as soon as the fast and slow lines cross, it indicates that the next wave of upward movement will depend on the fast and slow lines crossing upwards through the zero axis.
The 4-hour chart is still in a descending channel. If it continues to operate downwards and breaks below 111920, it may create a new low with support at 105000 to 107000 before looking for a rebound. The second scenario is if 113500 is not broken, then a breakout from the channel could test the resistance at 116000 again to see if it can recover.
Support: 111920 to 113500
Resistance: 116000 to 117500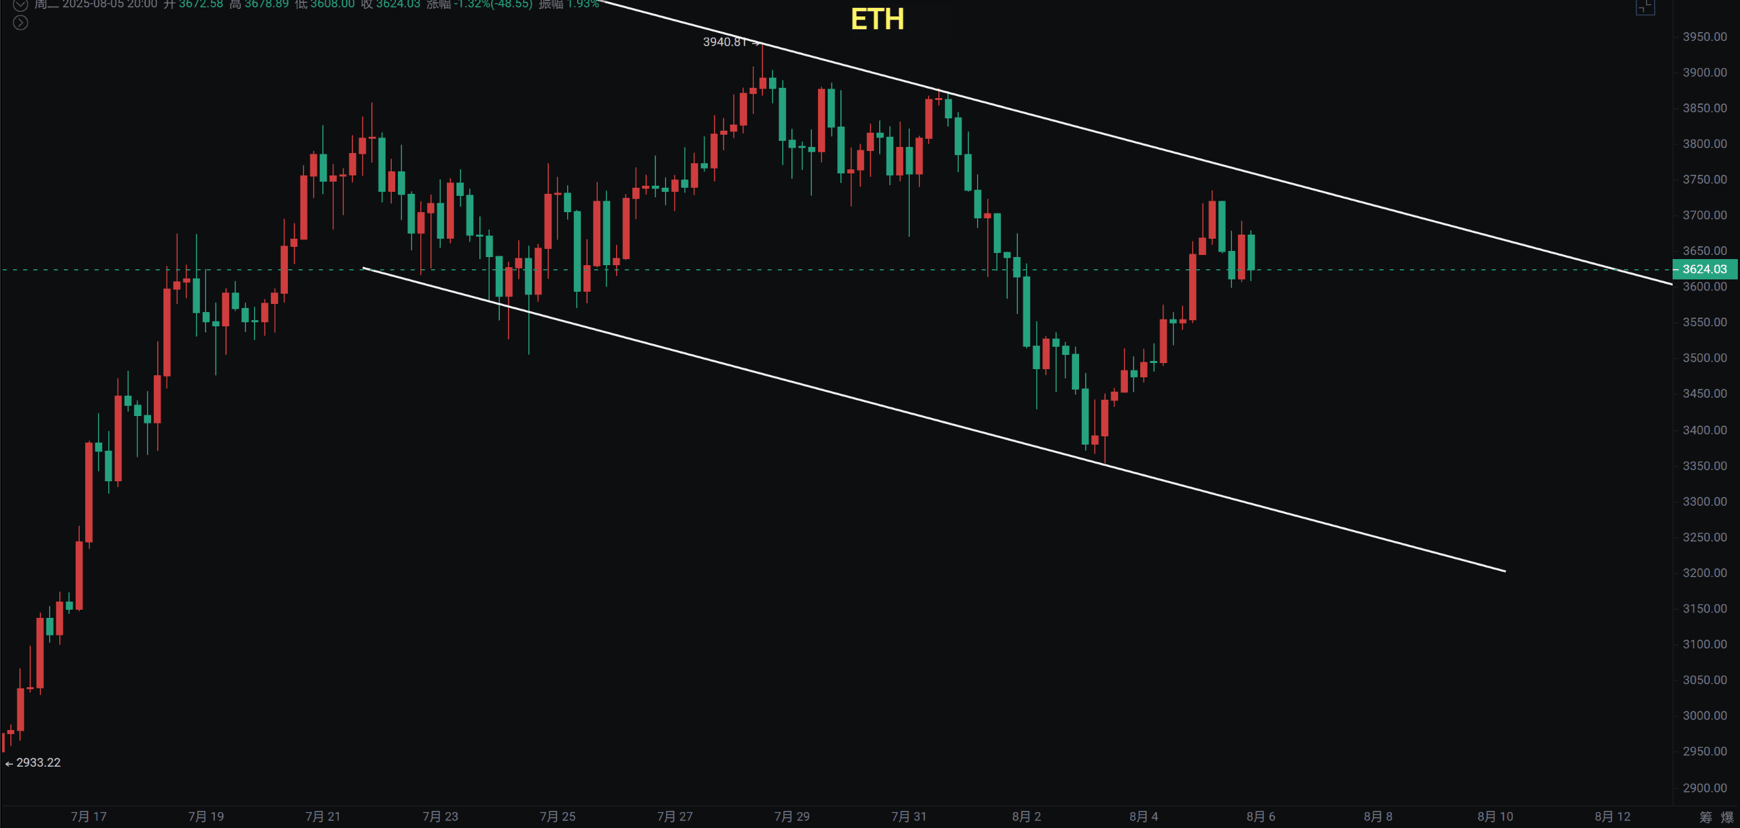
Ethereum
The lowest drop was to 3352, with a rebound under pressure below 3750. On the 4-hour chart, it is under pressure from MA20 and MA60, with short-term support seen at 3500.
Yesterday, the daily chart formed a morning star, but the daily chart did not break MA20, so attention should be paid to the U.S. stock market trends, which influence short-term movements. The monthly MACD shows a bullish divergence, and the fast and slow lines are crossing, so in this situation, if Bitcoin stabilizes and oscillates upwards, Ethereum has a chance to continue rising.
Support: 3350 to 3500
Resistance: 3750 to 4941