Candlestick patterns are used to predict the future direction of price movement. In this article, we will look at 16 of the most common candlestick patterns and how you can use them to identify trading opportunities.
What is a candle?
A candle is a way of displaying information about the price movement of an asset. Candlestick charts are one of the most popular components of technical analysis, allowing traders to quickly interpret price information from just a few price bars.
This article focuses on daily charts, where each candle describes trading for one day. It has three main components:
- The body which represents the range from open to close;
- Wick, or shadow, which indicates intraday highs and lows;
- The color, which shows the direction of market movement – a green (or white) body indicates a price increase, while a red (or black) body indicates a price decrease.
Over time, individual candles form patterns that traders can use to recognize key levels of support and resistance. There are a great many candles that indicate potential in the market – some provide insight into the balance between buying and selling pressure, while others define continuation or market indecision patterns.
Before you start trading, it is important to familiarize yourself with the basics of candlestick patterns and how they can influence your decisions.
Practice reading candlestick patterns
The best way to learn to read candlestick patterns is to practice opening trades and exiting them based on the signals they provide. You can develop your skills in a risk-free environment by opening a demo account, or if you feel confident enough to start trading, you can open a real account today.
When using any candlestick pattern, it is important to remember that while they are excellent for quickly predicting trends, they should be used alongside other forms of technical analysis to confirm the overall trend.
Six Bullish Candlestick Patterns
Bullish patterns can form after a downtrend in the market and signal a reversal in price movement. They are indicators for traders to consider opening a long position to profit from any upward trajectory.
Hammer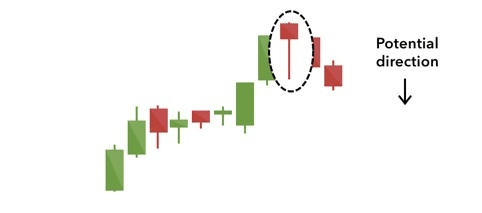
The candlestick pattern 'Hammer' is formed from a short body with a long lower wick and is located at the bottom of a downtrend.
The indicator shows that while there was selling pressure during the day, ultimately strong buying pressure pushed the price back up. The body color may vary, but green hammers indicate a stronger bullish market than red ones.
Inverted Hammer
The bullish counterpart is the inverted hammer. The difference is that the upper wick is long while the lower is short.
This indicates buying pressure followed by selling pressure that was not strong enough to lower the market price. An inverted hammer suggests that buyers will soon gain control of the market.
Bullish Engulfing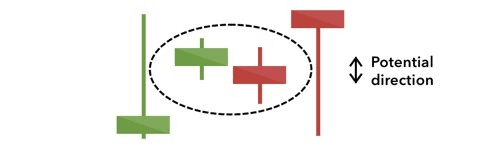
The bullish engulfing pattern is formed from two candles. The first candle is a short red body that is completely engulfed by a larger green candle.
Although the second day opens lower than the first, the bullish market pushes the price up, resulting in a clear win for buyers.
Piercing Candle
The piercing candle also represents a two-stick pattern, consisting of a long red candle followed by a long green candle.
Typically, there is a significant gap down between the closing price of the first candle and the opening price of the green candle. This indicates strong buying pressure as the price rises to the midpoint of the previous day or above it.
Morning Star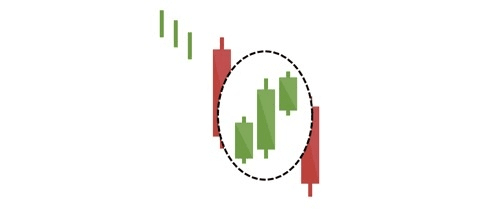
The candlestick pattern 'Morning Star' is considered a sign of hope during a gloomy downtrend in the market. It is a three-stick pattern: one candle with a short body between a long red and a long green. Traditionally, the 'star' will not overlap with the longer candles, as there are market gaps both at the opening and closing.
This indicates that the selling pressure of the first day is easing, and a bullish market is on the horizon.
Three White Soldiers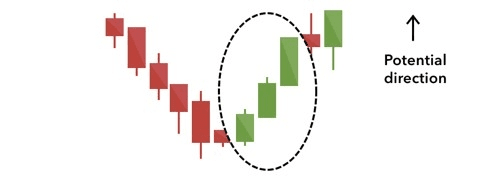
The 'Three White Soldiers' pattern repeats over three days. It consists of three consecutive long green (or white) candles with small wicks, opening and closing progressively higher than the previous day.
This is a very strong bullish signal that occurs after a downtrend and indicates sustained buying pressure growth.
Six Bearish Candlestick Patterns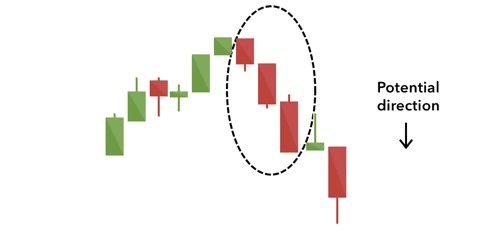
Bearish candlestick patterns typically form after an uptrend and signal a resistance point. Strong pessimism regarding the market price often leads traders to close their long positions and open short positions to take advantage of the price drop.
Hanged Man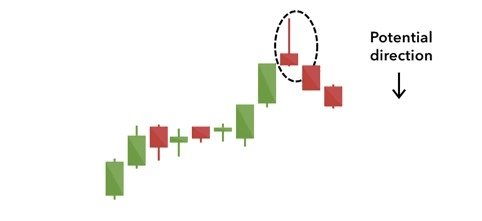
The Hanged Man is the bearish equivalent of the hammer; it has the same shape but forms at the end of an uptrend.
This indicates that there was significant selling during the day, but buyers were able to push the price back up again. A large sell-off is often seen as a sign that bulls are losing control of the market.
Shooting Star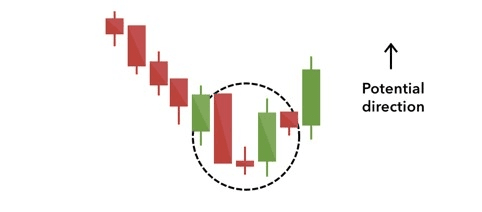
The shooting star has the same shape as the inverted hammer, but is formed in an uptrend: it has a small lower body and a long upper wick.
Typically, at the opening, the market slightly increases the gap and rises to the intraday high before closing at a price just above the opening level – like a star falling to the ground.
Bearish Engulfing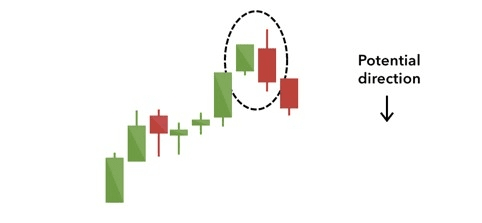
The bearish engulfing pattern occurs at the end of an uptrend. The first candle has a small green body, which is engulfed by the subsequent long red candle.
This signifies a peak or slowdown in price movement and is a sign of an impending market decline. The lower the second candle falls, the more significant the likely trend.
Evening Star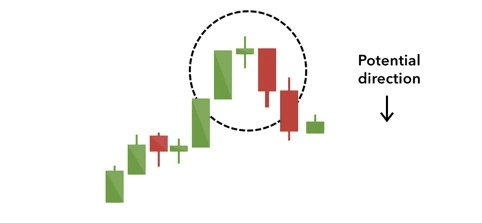
The evening star is a three-candle pattern that is the equivalent of the bullish morning star. It consists of a short candle sandwiched between a long green candle and a large red candlestick.
It indicates a reversal of an uptrend and is particularly strong when the third candle erases the gains of the first candle.
Three Black Crows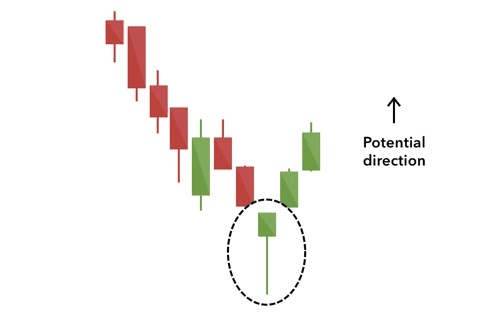
The candlestick pattern 'Three Black Crows' consists of three consecutive long red candles with short or nonexistent wicks. Each session opens at a price similar to the previous day's price, but selling pressure pushes the price lower and lower with each close.
Traders interpret this pattern as the beginning of a bearish downtrend, as sellers have outpaced buyers for three consecutive trading days.
Dark Cloud Cover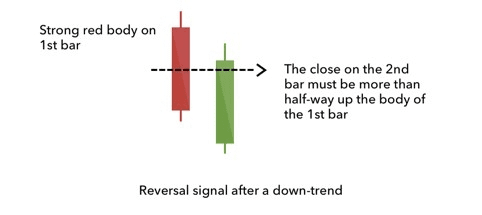
The candlestick pattern 'Dark Cloud Cover' indicates a bearish reversal – a dark cloud over the optimism of the previous day. It consists of two candles: a red candle that opens above the previous green body and closes below its midpoint.
This indicates that bears have taken control of the session, sharply driving the price down. If the candle wicks are short, it suggests that the downtrend was exceptionally decisive.
Four Continuation Candlestick Patterns
If the candlestick pattern does not indicate a change in market direction, it is known as a continuation pattern. They can help traders identify periods of market consolidation, characterized by market indecision or neutral price movement.
Doji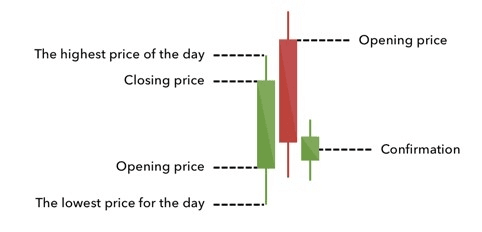
When the market opens and closes at nearly the same price point, the candle resembles a cross or a plus sign – traders should pay attention to the short or nonexistent body with wicks of varying lengths.
This doji pattern conveys the struggle between buyers and sellers, resulting in no net gain for either side. The doji itself is a neutral signal, but it can be found in reversal patterns such as the bullish morning star and the bearish evening star.
Spinning Top
The candlestick pattern 'Spinning Top' has a short body located at the center between wicks of equal length. The pattern indicates indecision in the market, resulting in no significant price change: bulls raised the price higher, while bears pulled it back down again. Spinning tops are often interpreted as a period of consolidation or rest after a significant uptrend or downtrend.
The spinning top itself is a relatively favorable signal, but it can be interpreted as a sign of upcoming events, as it indicates that current market pressure is losing control.
Three Falling Method
Three Method Patterns are used to predict the continuation of the current trend, whether bearish or bullish.
The bearish pattern is called 'Three Falling Method.' It is formed from a long red body followed by three small green bodies and another red body – all green candles are within the range of bearish bodies. This shows traders that the bulls lack the strength to reverse the trend.
Three Rising Method
The opposite is true for the bullish pattern called the candlestick pattern 'Three Rising Method.' It consists of three short red shades positioned within two long green ones. The pattern shows traders that despite some pressure from sellers, buyers maintain control of the market.
If you liked the content, write "Ready" and click 'subscribe', 'like', 'comment', and 'share' with others. Thank you!❤️
