Analyst Identifies Two Targets to Take Profit as Shiba Inu Signals Bullish Breakout After Closing Inside Volume Zone
$SHIB Shiba Inu has reclaimed a key accumulation zone, signaling a potential breakout from a long consolidation phase.
In a post on X, crypto analyst Wyckoff Insider highlighted the move, calling for a long entry based on the current price action. Meanwhile, SHIB is trading at $0.00001215, down by 1.5% in the last 24 hours and increasing its weekly loss to 11%.
💥Shiba Inu’s Daily Candle Confirms Entry into Volume Zone
According to Wyckoff Insider, a recent daily candle closed within a high-volume profile zone. This indicates that the price has re-entered a value area: a level where significant trading activity previously occurred. Analysts often interpret such price action as bullish, especially when supported by long-term accumulation.
This technical pattern typically indicates renewed buyer interest after a consolidation phase. Notably, the analysis outlines a long entry strategy, with the stop-loss placed just below the Last Point of Support, the final low that forms before a potential upward trend begins.
💥Accumulation Zone Provides Support Structure for SHIB
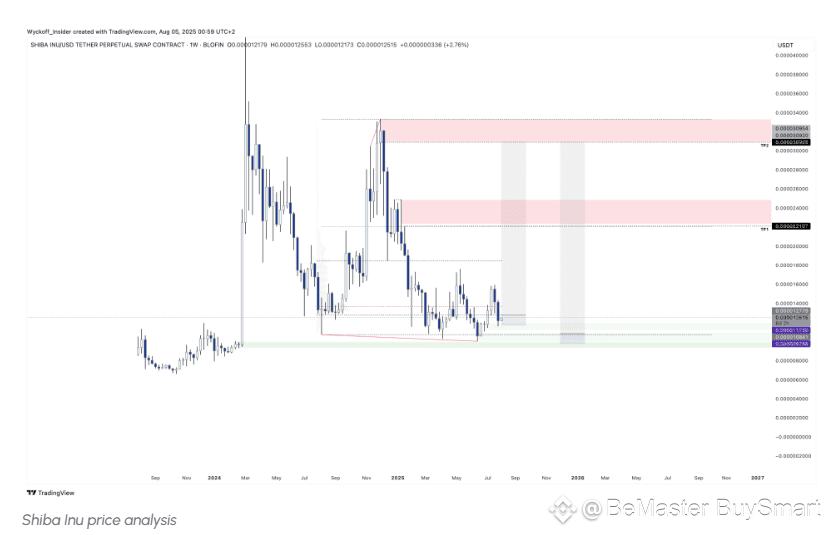
On the chart, SHIB has repeatedly tested a support zone between $0.000009788 and $0.000011726. This area has historically acted as a base for accumulation, where buyers absorb selling pressure. The chart also shows long wicks below this zone, suggesting failed breakdown attempts and increased demand at lower levels.
The Last Point of Support rests between $0.000011726 and $0.000011841. Wyckoff Insider recommends placing a stop-loss just below this level to manage downside risk if the structure fails.
💥SHIBA INU’s Upside Targets: $0.000022 and $0.000039
If the price holds above the support zone and continues upward, the first target is $0.000022107. This level coincides with previous resistance from late 2024. The second target is $0.000039005, which reflects the top of a larger supply zone formed during the peak rally.
Both levels represent key price points where SHIB faced historical selling pressure. Traders are watching for confirmation that the token can break through these zones and sustain higher prices.
💥Analyst Predicts Shiba Inu Rally $SHIB
Despite the recent loss, analysts remain optimistic. Joe Swanson pointed to a developing cup-and-handle pattern on the daily chart, formed after SHIB rebounded from a June low of $0.00001002 to a July high of $0.00001597.
He noted that the current pullback represents the handle, signaling a potential breakout. With ongoing whale accumulation, Swanson projected a 70% rally toward $0.00002150 once SHIB clears the pattern’s neckline at $0.00001715.
Despite this sentiment, Shiba Inu, currently ranked 22nd with a market cap of $7.26 billion and trading at $0.00001233, has slipped out of the top 20 cryptocurrencies, marking a significant decline from its former top 10 glory in 2021 and again briefly in 2024.
Internal conflicts, anonymous leadership, and lack of institutional backing have all contributed to its downfall. While projects like Dogecoin have attracted ETF interest, SHIB remains retail-driven and burdened by an enormous token supply of 589 trillion.
Despite the setbacks, the Shiba Inu team remains optimistic, with figures like Lucie encouraging long-term holders and hinting at ambitious price goals, including the dream of hitting $ 0.01.
🚀🚀🚀 FOLLOW BE_MASTER BUY_SMART 💰💰💰
Appreciate the work. 😍 Thank You. 👍 FOLLOW BeMaster BuySmart 🚀 TO FIND OUT MORE $$$$$ 🤩 BE MASTER BUY SMART 💰🤩
🚀🚀🚀 NOT JUST LIKE BUT, CLICK FOLLOW BE MASTER BUY SMART - Thank You.

