


Ethereum (ETH) is flashing strong signals of a potential breakout, with a confluence of on-chain data, technical patterns, and trader sentiment pointing to a significant rally. While the price has faced recent volatility, three key indicators suggest that a "bear trap" may be in play, setting the stage for a new phase of explosive growth. Is Ethereum ready to leave its current consolidation phase and surge past US$4,000?
Whale Accumulation & Bullish Sentiment: Confidence Returns 🐳
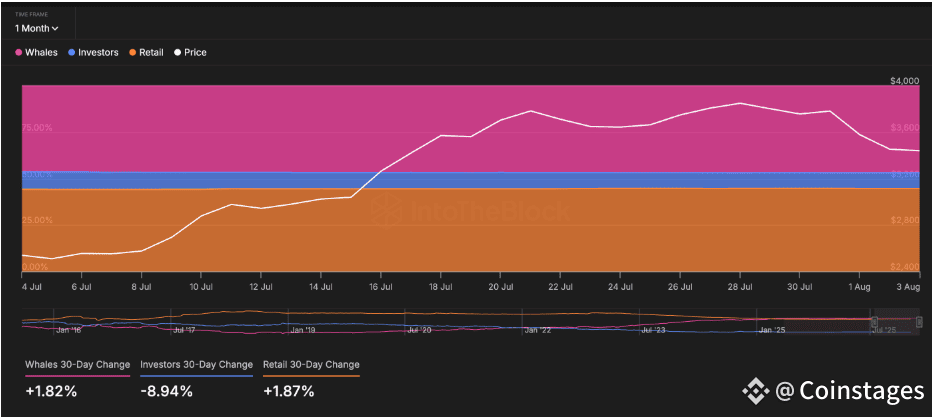
On-chain data reveals a powerful bullish signal: a significant increase in whale and retail holdings. Over the past 30 days, whale addresses have increased their ETH ownership by 1.82%, while retail wallets have grown their holdings by 1.87%. This redistribution of holdings from mid-sized investors to both whales and retail suggests a return of confidence in Ethereum's long-term value. Furthermore, data from IntoTheBlock's Bull vs. Bear chart shows a dominant trend of accumulation, with buyers outnumbering sellers by a staggering 7:1 ratio over the last week.
The Traders' Bet: Binance Long-Short Ratio Soars 📊
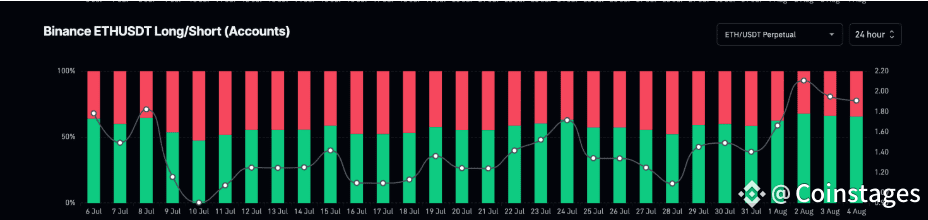
The market sentiment among traders is overwhelmingly bullish, a crucial indicator for future price action. The Binance long-short account ratio stands at a remarkable 1.91, meaning there are nearly twice as many accounts holding long positions (betting on a price increase) as there are short positions. This ratio, which has historically preceded significant directional movements, suggests that traders are highly confident in Ethereum's ability to appreciate. The recent price volatility, which briefly liquidated some short positions, may have been a “bear trap” that only strengthened this bullish resolve.
The Ascending Triangle: A Technical Path to a Breakout 🎯
On the daily chart, Ethereum has been consolidating within a classic ascending triangle pattern after a sharp rise. This pattern is a key bullish indicator that often precedes a major upward breakout. Despite briefly falling below key support levels, the price has since rebounded, reinforcing the pattern's validity. The article suggests that a daily candle close above US$3,785 could be the trigger for a move to test the US$3,939 resistance and potentially break out past US$4,051. However, this bullish scenario would be invalidated if the price falls below the key support level of US$3,356.
Conclusion
Ethereum is flashing strong signals of an impending breakout, driven by whale accumulation, bullish trader sentiment, and a powerful ascending triangle pattern on its daily chart. The recent redistribution of holdings to both whales and retail investors, along with an overwhelming long-short ratio, points to a market that is consolidating before a significant move. As Ethereum nears the top of its ascending triangle, the coming days will be a crucial test of strength, with a successful breakout potentially paving the way for a major rally.
Disclaimer
This article is for informational purposes only and does not constitute financial advice. Cryptocurrency investments carry a high level of risk and volatility. Always conduct your own research (DYOR) and consult a professional financial advisor before making any investment decisions.