I am 31 years old, started trading coins at 22, and by 2023-2024, my funds reached eight digits. Now when I go out, I must stay in high-end hotels costing around 2000 yuan, with suitcases and hats possibly bearing crypto symbols. It is much more comfortable than what the older generation experienced in real businesses or what the post-80s experienced in e-commerce.
I have hardly experienced any troublesome transactions with others, so there are fewer worries.
The most important thing in trading coins is a good mindset; technique is secondary.
1. In most cases, Bitcoin is the leader of the ups and downs in the crypto market; Ethereum is strong but sometimes can break away from Bitcoin's influence and create a unilateral trend. Altcoins generally cannot escape its influence;
2. Bitcoin and USDT move inversely; if you notice USDT has risen, be cautious of a drop in Bitcoin; when Bitcoin rises, it is an appropriate time to buy USDT;
Between 0:00 and 1:00 AM, there is a tendency for spike phenomena, so domestic coin friends can try to set a buy price for their favorite coin as low as possible before sleeping and a sell price as high as possible, and perhaps it will be executed.
4. Every morning between 6 and 8 AM is a time to judge whether to buy or sell, and also a time to determine the day's rise or fall. If it has been falling from 0:00 to 6:00, and continues to fall during this period, it is a good time to buy or add to positions, and generally, it will rise that day. If it has been rising from 0:00 to 6:00, and continues to rise during this period, it is a selling time, and there is a high probability it will drop that day.
5. The time around 5 PM is an important point of attention according to rumors in the market; due to time zone differences, American friends have started work, which may cause fluctuations in coin prices, and significant rises or falls have indeed occurred at this time, so it requires special attention;
6. There is a saying about "Black Friday"; there have been a few occasions where a significant drop happened on a Friday, but there have also been significant rises or sideways movements, so it is not particularly accurate; just pay attention to the news.
7. Having a certain trading volume guarantee; if it drops, don’t worry, patience in holding will definitely lead to a recovery; in the short term it may take 3 or 4 days, or longer up to a month. If you have excess USDT, you can buy in batches to pull the price down, which will help recover faster. If you don’t have excess funds, just wait; it won’t let you down. Unless you really bought at 1;
8. Spot trading with less trading frequency yields greater returns than frequent trading, it just depends on whether you have the patience to hold. I bought Dogecoin at 0.089, and it has multiplied more than 20 times since I held it.
After much contemplation, I decided to share my short-term trading insights, which started with 50,000 and grew to 23.98 million within two short years!
If you are currently at a loss and want to make trading coins your second career in the future, please take a serious look; you will definitely gain something, and I suggest you bookmark it!
A strong trend reversal signal: "Three White Soldiers and Three Black Crows" trading strategy!
In the trading market, we can encounter many different patterns on charts. Today, we introduce a trading strategy based on two candlestick patterns:
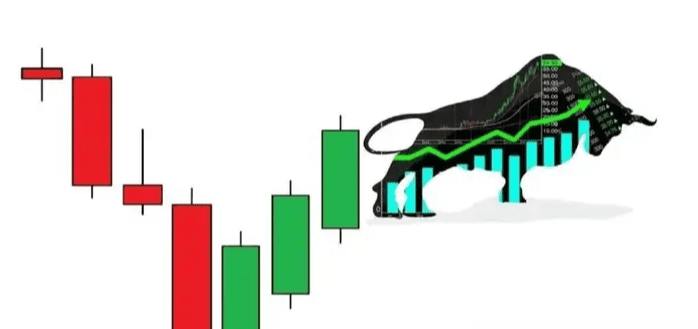
1. "Three White Soldiers" Forex trading strategy 2. "Three Black Crows" Forex trading strategy First, let's get to know these two chart patterns. Three White Soldiers (Three White Soldiers) is a candlestick pattern composed of 3 bullish candlesticks.
In a downward trend, this pattern sends a strong reversal signal. This price pattern is quite accurate for judging bullishness and should not be ignored.
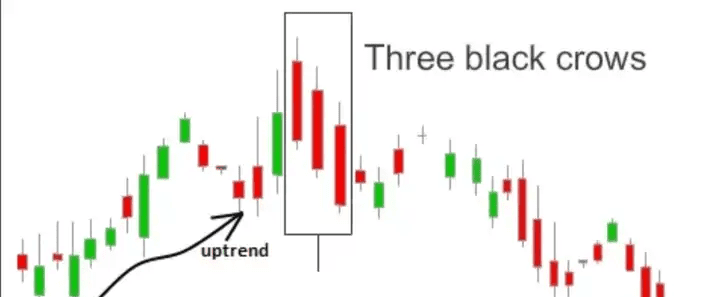
Conversely, Three Black Crows (Three Black Crows) is a candlestick combination pattern formed by 3 bearish candlesticks in an uptrend, usually implying a price reversal downward.
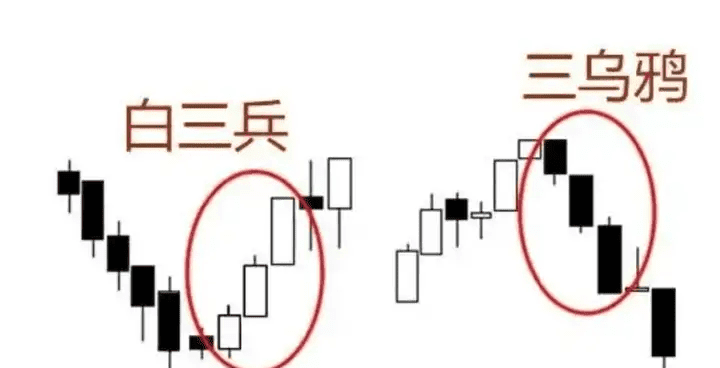
Note that these two chart patterns can be used in combination. For ease of understanding, we will call it the "Three White Soldiers and Three Black Crows Trading Strategy."
The characteristics of the Three White Soldiers chart pattern, as mentioned above, is a bullish reversal candlestick pattern, "it consists of 3 bullish candlesticks:
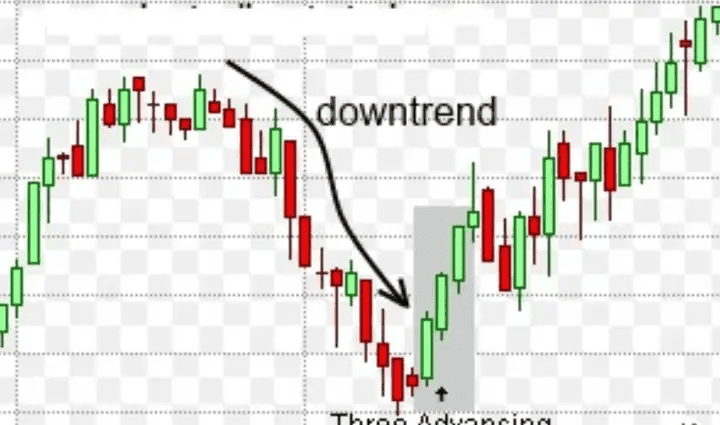
1. The market must be in a downward trend;
2. You will observe three bullish candlesticks forming on the chart, these bullish candlesticks continuously form the Three White Soldiers chart pattern.
3. Each candlestick must open (be created) within the body of the previous candlestick.
4. The closing price of each candlestick must be higher than the closing price of the previous candlestick.
When observing the Three White Soldiers pattern forming in a downward trend, you should at least pay attention, as this is a potential signal for a trend reversal.
When you see these candlestick patterns, the first thing that comes to mind is that they may send you a "bullish" signal. We want to see these candlesticks have longer bodies, indicating either that many bulls are entering the market or that bearish traders are taking profits.
Characteristics of the Three Black Crows chart pattern
The Three Black Crows chart pattern is completely opposite to the Three White Soldiers chart pattern. The Three Black Crows pattern is a bearish reversal chart pattern composed of 3 bearish candlesticks.
1. The market must be in an uptrend.
2. You observe three bearish candlesticks and confirm that the Three Black Crows pattern is forming;
3. Each candlestick must open (be created) within the body of the previous candlestick.
4. The closing price of each candlestick must be lower than the closing price of the previous candlestick. In daily trading, if you observe the Three Black Crows pattern appearing in an upward trend chart, you should take note that this is a signal that the trend is about to reverse.
How to trade the Three White Soldiers and Three Black Crows patterns?
The advantage of this trading strategy is that it does not require any indicators, as it is a purely price action trading strategy, allowing us to decide how to trade based on price movements.
Time frame: As with any chart pattern trading strategy, it is recommended to trade in higher time frames as the effect will be better. Of course, you can also use these time frames in intraday trading.
Currency pairs: can be any currency pair in a trend.
Indicator: This strategy purely belongs to price action, so no trading indicators are needed.
Trading rules:
1. If a Three White Soldiers pattern forms on the chart, you can set a buy stop-loss order 3-5 points above the high point of the third candlestick; or if a Three Black Crows pattern forms, you can set a sell stop-loss order 3-5 points below the low point of the third candlestick.
2. If you set a sell stop-loss order, you can place the stop-loss above the high point of the third candlestick; if it is a buy stop-loss order, set the stop-loss below the low point of the third candlestick. Additionally, you can set a trailing stop to prevent the price direction from reversing.
3. For profit-taking, you can use the previous volatility high or low as a target.
4. When the profit target is at least half reached, you can appropriately take some profits.
Important trading reminders
It is worth noting that not all chart formations of three white soldiers and three black crows are valid, so they can only be used as trading signals.
Like most trading patterns, these two patterns can also be "illusions".
Additionally, it is also important to judge the position of the Three White Soldiers and Three Black Crows patterns, focusing on:
Support and resistance levels
Pivot level point
Fibonacci levels
The above positions are all important areas, especially when used on charts with higher time frames.
Aside from these important positions, you should trade the Three White Soldiers and Three Black Crows patterns cautiously, because other than this, there truly is no reason to expect a price reversal point.
Additionally, be cautious when trading the combination of these two patterns; once the price deviates from the pattern, a reversal may occur later and retest, at which point you may be stopped out.
Disadvantages of the strategy
Each trading strategy has its weaknesses; one of the weaknesses of this strategy is that the stop-loss distance for the two patterns is relatively large. If you enter a trade, your stop-loss distance needs to be enlarged, which may force you to reduce your position size.
When these patterns form, it does not necessarily mean a true reversal signal; after you enter the market, you may find that the price merely reverses temporarily.
Advantages of the strategy
If this strategy can develop as planned in a good trending trade, you can easily make a profit, especially in larger time frames of 1 hour or more.
The pattern opposite to the Three Black Crows is called the Three White Soldiers pattern, or more colloquially, the Three White Soldiers pattern (as shown in the figure below). Many candlestick technical terms are inextricably linked to war, and this pattern is a typical example. This pattern consists of three consecutive white candlesticks, where their closing prices rise sequentially. When the market stabilizes at a low price for a period of time, if such a pattern appears, it signifies that the market is about to strengthen.
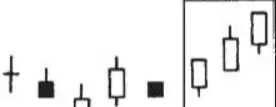
The Three White Soldiers pattern manifests as a gradual and stable upward process, where the opening price of each white candlestick is within or near the previous day’s white body. The closing price of each white candlestick should be at or near the highest point of the day. This is a very robust way for the market to rise (however, if these white candlesticks extend too long, we should also be wary of the market being overbought). If the second and third candlesticks, or just the third candlestick, show signs of weakening bullish momentum, it constitutes a blocking pattern ahead (as shown in the figure below).
This means that this round of rising trend has encountered trouble, and those holding long positions should take some protective measures.
Especially in the late stage of an uptrend, if a blocking pattern appears ahead, one should be more cautious.
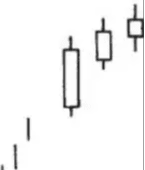
In the blocking pattern ahead, as a specific manifestation of weakening bullish momentum, it may be that the white bodies are getting smaller or that the last two white candlesticks have relatively long upper shadows. If in the last two candlesticks, the previous one is a long white body creating a new high, and the last one is just a small white candlestick, then it constitutes a pause pattern (as shown in the figure below).
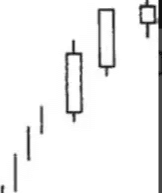
Sometimes, this pattern is also called the contemplation pattern. When this pattern appears, it indicates that the strength of the bulls has at least temporarily exhausted. In this pattern, the last small white candlestick may gap up from the previous long white candlestick (in this case, this candlestick becomes a star candlestick), or as Japanese analysts describe, "sitting on the shoulder of that long white body" (meaning it is at the upper end of the previous long white body). This small body exposes the decline of the bullish energy. When the pause pattern occurs, it constitutes a crucial opportunity for bulls to close positions and take profits.
Although the blocking pattern ahead and the pause pattern generally do not belong to reversal patterns, sometimes they can also lead to significant downward trends that should not be ignored. We should use the blocking pattern ahead and the pause pattern to close existing long positions or take protective measures for long positions, but we should not open short positions based on them. In general, if these two types of patterns appear at higher price levels, they have greater predictive significance.
The above pattern may occur in low price areas or during a bullish trend. There is not much difference between the pattern of being blocked ahead and the pause pattern. Regarding Three White Soldiers, the main factor to consider is if the closing price of each of the three candlesticks is at or near the highest price of the period, it is the most constructive. If the last two candlesticks show signs of hesitation, having small bodies or upper shadows, then these clues indicate that the bullish trend is weakening.
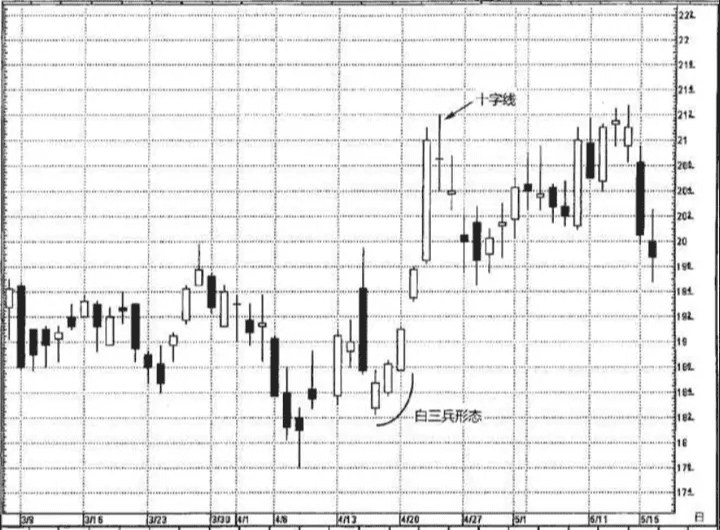
Figure 4 Intel - Daily Candlestick Chart (Three White Soldiers Pattern)
Figure 4 shows a classic example of the Three White Soldiers pattern, as the closing prices of each candlestick, especially the last two, are relatively strong. The opening price of the candlesticks is close to the lowest point of that period, and the closing price is at or near the highest point of that period. April 23rd was a doji, forming a doji pattern, indicating that the market is in a hesitant state.
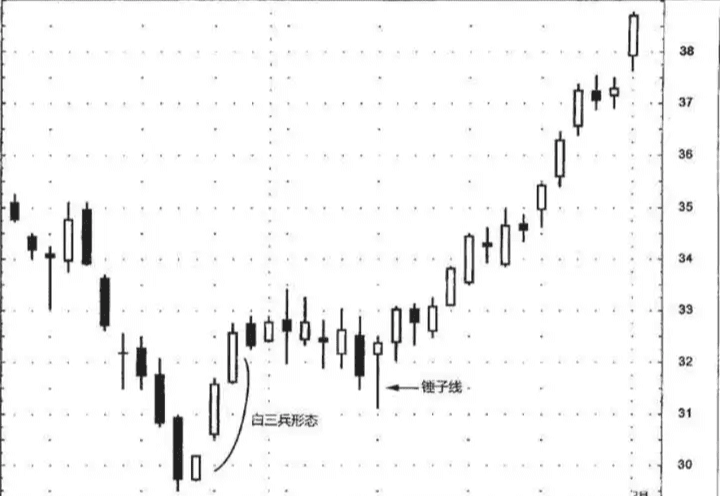
Figure 5 Microsoft - Daily Candlestick Chart (Three White Soldiers Pattern) Figure 5 is a good example of the Three White Soldiers pattern. The closing prices of the three white candlesticks are very close to the highest price of that period, and each opening price is within or above the previous candlestick's body. One aspect to consider regarding the Three White Soldiers pattern is that by the time the pattern is completed, the market may have significantly moved away from its low. In this example, Microsoft left its low by almost $4, which is a considerable price change. Therefore, unless traders have a long-term bullish outlook, buying when the Three White Soldiers pattern is completed may not offer an attractive risk-reward ratio.
I found that after the Three White Soldiers pattern appears, once the market adjusts, the first or second white candlestick, which is the starting point of the Three White Soldiers, often forms a support level. In this case, after the Three White Soldiers pattern appears, the stock enters a consolidation phase, slowly falling until forming a hammer candlestick. This validates the support level formed within the second candlestick of the Three White Soldiers pattern.
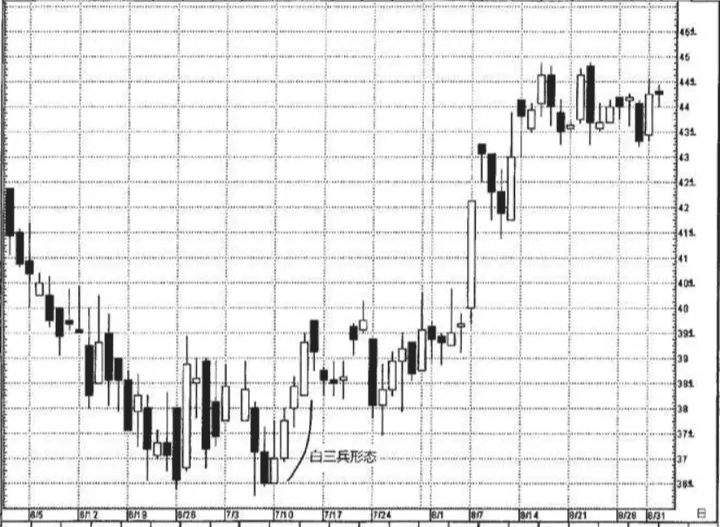
- Daily Candlestick Chart (Three White Soldiers Pattern) Figure 6 Praxair
In Figure 6, a bottom formed in mid to late June and early July around $36.50. Then, the Three White Soldiers pattern appeared (although they all had very short upper shadows), after which the third white candlestick, the stock began to hesitate and retraced to the interior of the first white candlestick of July 11. This figure illustrates again that sometimes the market may adjust after the Three White Soldiers pattern appears. Once an adjustment occurs, we expect the stock to find support when entering the interior of the second, especially the first white candlestick.
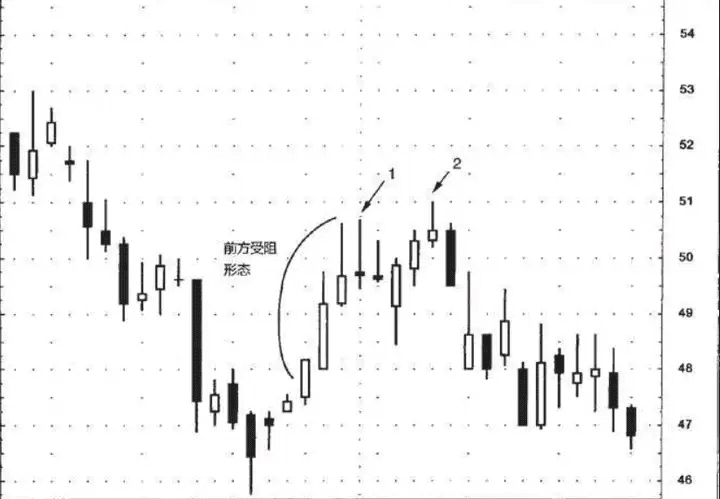
Figure 7 United Health - Daily Candlestick Chart (Blocking Pattern) Figure 7 shows an example of a blocking pattern ahead. Although there are three relatively high white candlesticks, the last two have bearish upper shadows. This reflects that the current bullish trend is blocked and has entered a pause. In fact, more candlesticks with upper shadows formed afterward; please see the marked positions 1 and 2 in the figure, revealing the resistance level close to $51. The candlestick at position 2 with a long upper shadow is a shooting star, which, together with the next day’s candlestick, forms a bearish engulfing pattern.
Trading is something that requires long-term persistence in learning and self-improvement. The learning content can generally be divided into three major directions.
① Learning on the technical level
② Learning about fundamental aspects
③ Learning about trading habits and psychology.
Finally, please remember to test the effectiveness of any trading strategy with a demo account before using it in real trading.
Creating is not easy; if this helps you, please click to follow!!!
Follow Brother Jie, eat nine meals a day! You choose how much to earn, but I only give you the opportunity once. Those who want to get on board should hurry, don’t regret after others have earned!
Market waits for no one; hesitation is missing out!