

Bubblemaps: The disruptor of on-chain data visualization
The complexity of blockchain data has always been a significant barrier preventing ordinary users from engaging in deep analysis. Traditional on-chain tools often require a professional technical background, while the emergence of Bubblemaps is changing this situation. It presents token distributions, wallet clusters, and hidden associations visually in a bubble chart format, shifting on-chain investigations from obscure technical analysis to more accessible data insights.
The underlying logic of the visualization engine
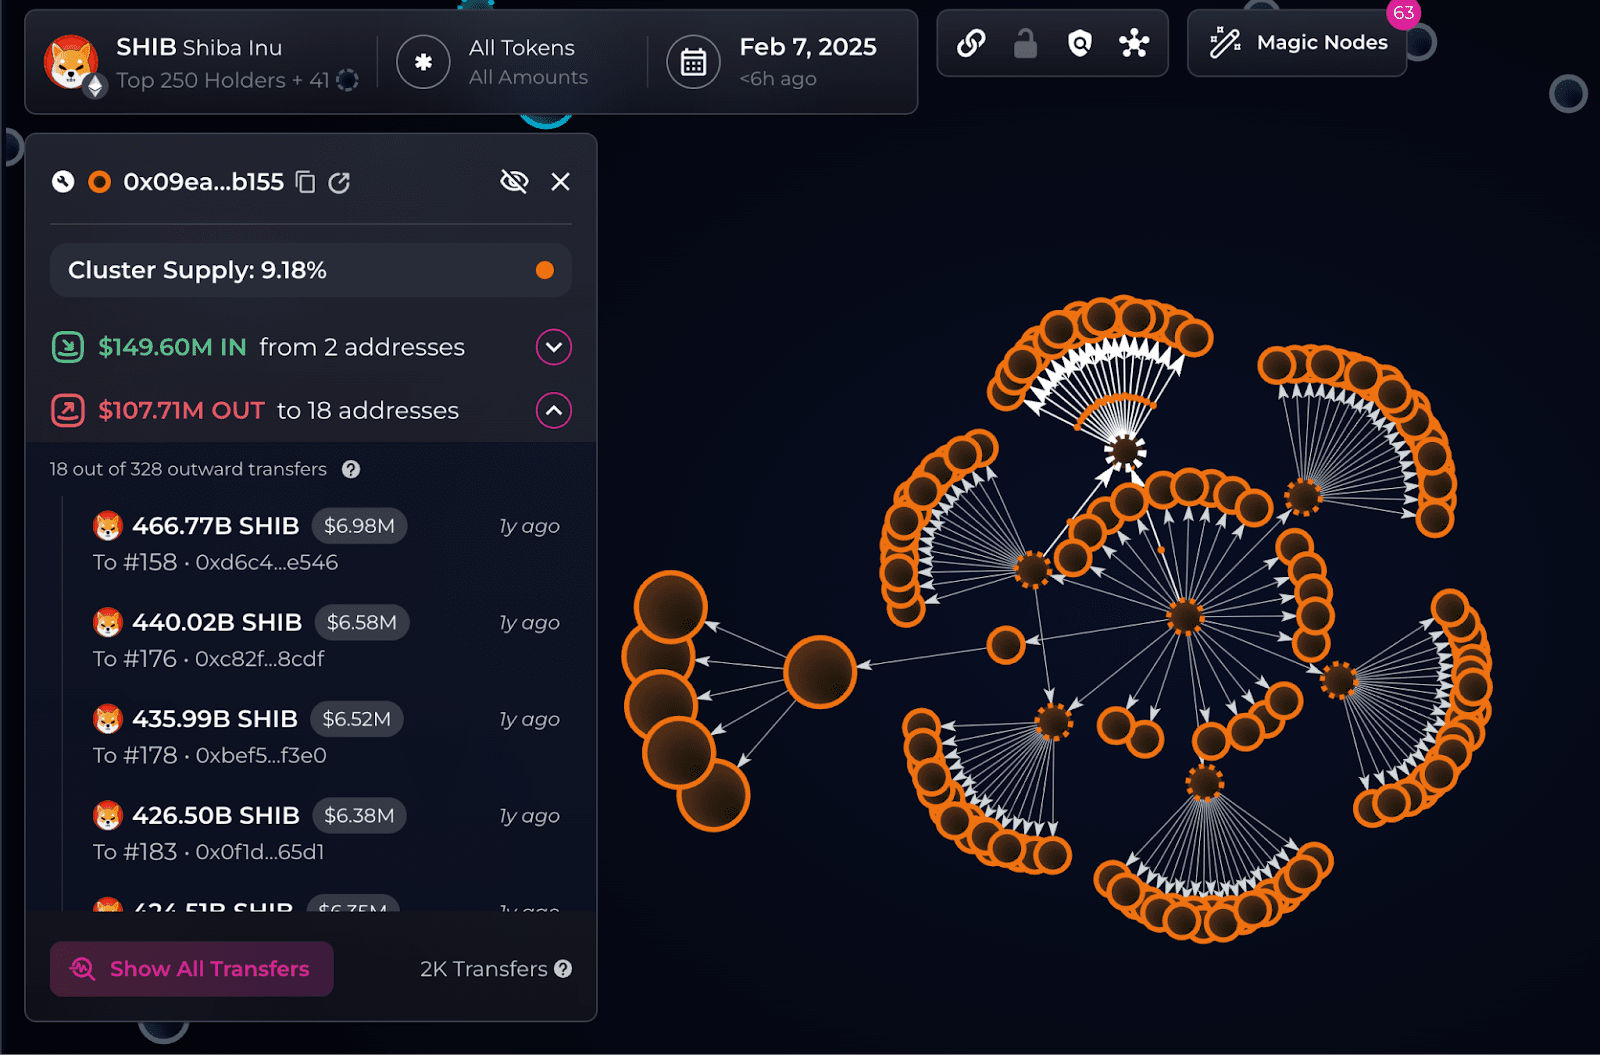
Bubblemaps' core competitive advantage lies in its data parsing capability. It does not settle for simply presenting transaction records; instead, it uses AI-driven 'magic nodes' to automatically identify anomalous clusters, such as potential market manipulation or token concentration risks. For example, if a new project's tokens are quickly controlled by a few addresses after listing, Bubblemaps' bubble chart will highlight these associated wallets, helping users quickly identify potential risks.
The time travel feature is another highlight. Traditional on-chain analysis tools usually only provide a current snapshot, while Bubblemaps allows users to trace the historical changes in token distribution. For instance, if a DeFi protocol experiences a large-scale token sell-off after an airdrop, users can clearly see which early holders are offloading by comparing timelines, thus enabling a more accurate assessment of market sentiment.
Cross-chain compatibility and practical applications
Currently, Bubblemaps supports major public chains like Ethereum, Solana, and BNB Chain. This cross-chain capability makes it one of the few analytical tools that can provide a comprehensive ecological perspective. For multi-chain investors, this means they no longer need to switch between different browsers to track assets but can compare token flows across different chains in a single interface.
In practical applications, the value of Bubblemaps has already been validated. For example, during a surge of a certain MEME coin, users discovered through Bubblemaps that over 40% of the tokens were concentrated in 5 associated addresses. This finding quickly spread through the community and ultimately influenced the market's valuation of that token. Similar cases are on the rise, indicating an increasing demand for transparency in on-chain data.
The economic model of the BMT token and community-driven
The role of the BMT token is not limited to being a payment tool; its more crucial function is to incentivize community participation in on-chain investigations. The Intel Desk mechanism allows holders to vote on investigation priorities, such as whether to track the flow of funds from a suspected runaway project. This model is similar to 'crowdsourced intelligence,' enabling decentralized community efforts to dig for clues in the blockchain.
In addition, the staking mechanism of BMT provides extra returns for long-term participants. Premium features such as the profit and loss calculator and AI-enhanced analysis require locking a certain amount of tokens to unlock, which both increases the usage scenarios of the tokens and reduces market selling pressure. From the recent Binance airdrop activity, the exchange's endorsement further enhances the liquidity expectations for BMT.
Market positioning and competitive barriers
Currently, competitors in the on-chain analysis space include Nansen and Arkham, but Bubblemaps differentiates itself with a lower cognitive threshold. Nansen is suitable for institutional users, Arkham is geared towards traders, while Bubblemaps' bubble chart design allows retail investors without programming backgrounds to quickly understand the data. This positioning as a 'lightweight professional tool' may become the key to penetrating the retail market.
The $3.2 million funding from the seed round is expected to be used for technological iteration and ecological expansion. If Bubblemaps can continue to optimize its AI detection algorithms and further reduce latency, it is likely to occupy a more central position in the field of on-chain monitoring.
The inevitable trend of on-chain transparency
With increasing regulatory pressure and users' rising demand for security, the transparency of on-chain data will become a necessity. The value of Bubblemaps lies not only in the tool itself but also in its promotion of a more open analytical culture—making market manipulation and fraudulent activities visible and inescapable.
For investors, the ability to skillfully use such tools may become a key factor distinguishing professionals from amateurs in the next cycle. Bubblemaps is providing the infrastructure for this transformation.