

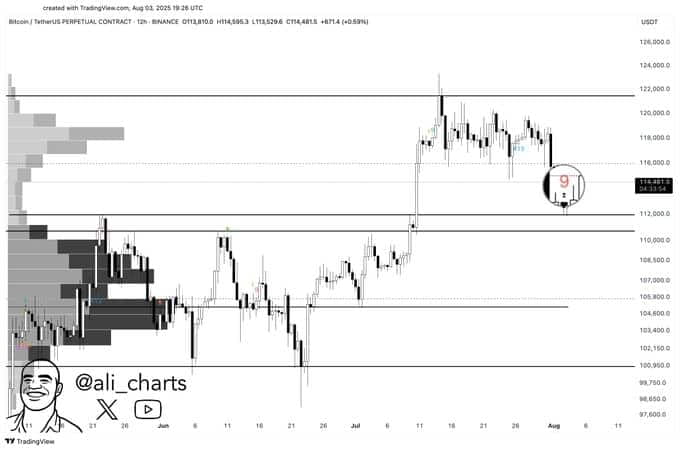
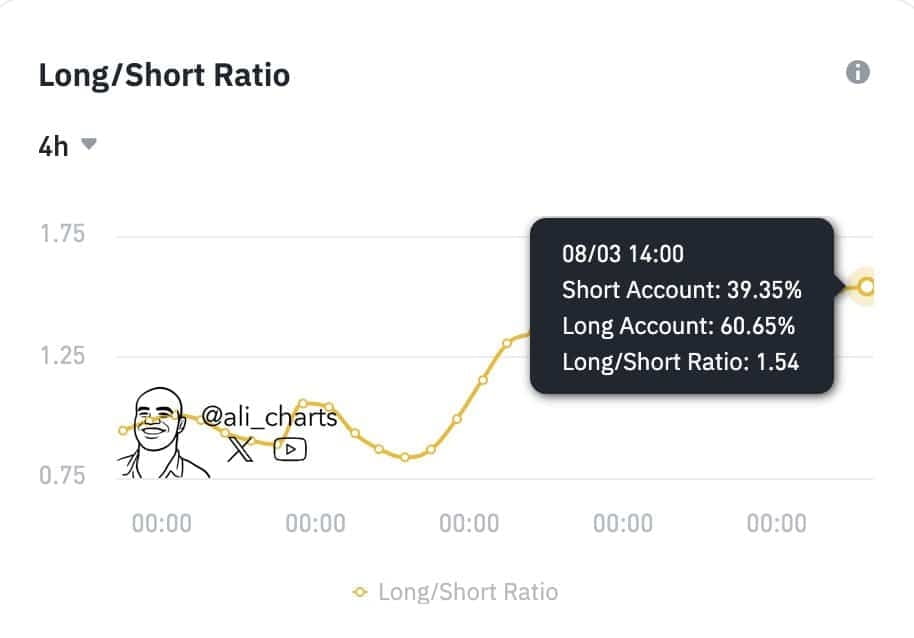
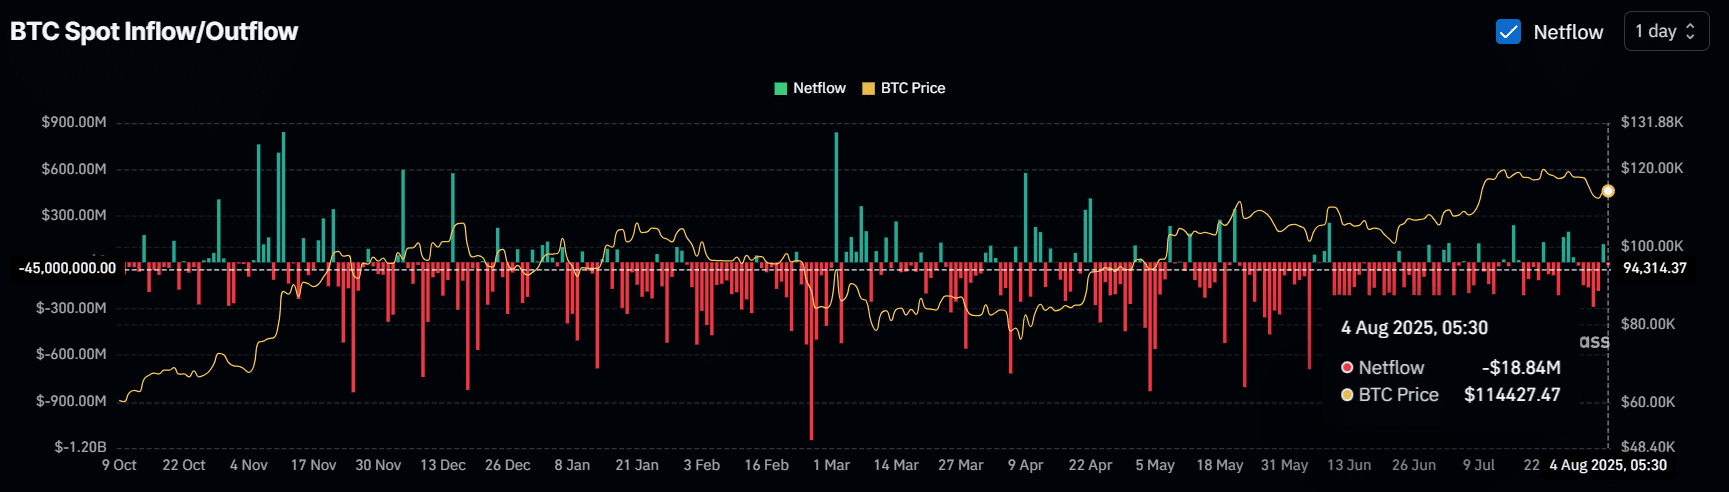
Bitcoin has just recovered from the 113,500 USD zone thanks to the 'Buy' signal from TD Sequential; the Long/Short Ratio hit 1.54, and 18.84 million USD withdrawn from exchanges indicates strong accumulation.
Bitcoin's price shows recovery strength after short-term reversal signals, combining with positive buying power and institutional money flow participation, contributing to a more positive market sentiment.
MAIN CONTENT
Bitcoin surged strongly from the 113,500 USD zone thanks to technical indicators and accumulated buying power.
Confirming bullish sentiment with a Long/Short ratio exceeding 1.54 and strong capital outflow from exchanges.
Technical signals support the potential for short-term recovery even though the medium-term trend still needs further observation.
What recent fluctuations has Bitcoin experienced?
Bitcoin has surged from 113,500 USD after the TD Sequential indicator issued a buy signal, the Long/Short ratio increased, and nearly 18.84 million USD was withdrawn from exchanges, indicating strong accumulation.
The 'Buy' signal from TD Sequential is one of the tools many technical analysts use to identify short-term trend reversal points in the cryptocurrency market.
Ali Martinez, Cryptocurrency analyst, posted on X, August 4, 2025
The fact that Bitcoin bounces from low price zones, accompanied by technical factors supporting reversals, rekindles interest from the investment community. Accumulated buying power increases, especially from institutions, creating balance and opening up short-term price recovery prospects.
The market watches technical indicators like TD Sequential or the Long/Short ratio to guide trading strategies when reversal or accumulation signals appear simultaneously.
What technical factors are supporting Bitcoin's recovery?
The TD Sequential indicator issued a 'Buy' signal on the 12-hour chart, supporting expectations for short-term Bitcoin price recovery.
TD Sequential is a prominent indicator that helps identify trend reversal points, often providing certain effectiveness in highly volatile markets like cryptocurrencies. When a buy signal appears, both trading volume and market sentiment tend to shift more positively.
Additionally, the inverted head and shoulders pattern also formed at the bottom, while the price broke above the boundary of the descending channel — these two technical factors play a role in driving buying pressure, helping many traders decide to buy in the low price zone.
How are liquidity and market structure changing?
Bitcoin's price hovers around 114,700 USD with an intraday growth of 0.89%. However, the 24-hour trading volume decreased by 14%, to 49.18 billion USD according to CoinMarketCap, reflecting investors' caution as prices rise again.
The decrease in trading volume sometimes contrasts with positive technical movements, indicating a divide in sentiment as well as capital flows. Nevertheless, the market structure is improving thanks to adherence to reversal patterns and buy signals.
Previously, divergence phases between volume and price have often indicated accumulation or preparation for significant volatility, especially when technical indicators like TD Sequential appear aligned with other signals.
Short-term trend: Can Bitcoin's price increase by 3.3%?
If it maintains upward momentum above 114,000 USD, Bitcoin could target the 118,000 USD zone — corresponding to a 3.3% growth according to technical analysis.
Descending channel patterns and inverted head and shoulders forming at the bottom are often precursors to short-term recovery waves in the cryptocurrency market, especially when accumulation money flow increases.
Technical study by AMBCrypto, August 4, 2025
The chart from TradingView illustrates the potential for breaking through the price range of the descending channel and creating a recovery wave. However, the Supertrend indicator is still mixed: the 4-hour chart still shows red (bearish) above the price, while the 1-hour chart detects a green shift (bullish) below the price, indicating that Bitcoin remains in a hesitant trading zone, without breaking into a clear trend.
This reality requires investors to be cautious, waiting for trend confirmations across multiple time frames and closely monitoring important short-term price signals.
Which analyst confirms the buy signal?
Cryptocurrency analyst Ali Martinez confirms that TD Sequential has just issued a buy signal on Bitcoin's (BTC) 12-hour chart, publicly shared on social media X on August 4, 2025.
Source: X (formerly Twitter)
The 'Buy' signal from TD Sequential clearly appeared alongside the price bounce around 113,500 USD, laying the foundation for recovery confidence in the short term.
Ali Martinez, Cryptocurrency analyst, X, August 4, 2025
The emergence of this signal aligns with other technical factors, reinforcing bullish sentiment in the short-term trading community.
In previous instances in the Bitcoin market, TD Sequential has made many accurate reversal forecasts in the context of strong price volatility, thus being closely monitored by many sharks and professional traders.
What does the Long/Short ratio on Binance signify?
The Long/Short Ratio of the BTCUSDT pair on Binance reached 1.54 according to new data from Ali Martinez on X, indicating that about 60.65% of open positions are Long — a group of traders expecting prices to rise.
Source: X
When the Long/Short ratio exceeds 1.5, the market typically expresses expectations for short-term price recovery, but the risks of order sweeps or strong fluctuations also increase.
CoinGlass Research, 2025
When most market positions shift to Long, investors should be cautious of the possibility of sudden price fluctuations, as the pressure to liquidate positions increases if prices reverse abruptly.
Compared to previous phases, the Long/Short ratio on Binance often leads short-term signals on trader sentiment, especially when combined with accumulated money flow and other reversal indicators.
How is the flow of money accumulating and moving from exchanges?
In the past 24 hours, Bitcoin worth 18.84 million USD has been withdrawn from exchanges according to CoinGlass data, a strong accumulation sign from long-term holders and investment organizations.
Source: CoinGlass
The typical trend of withdrawing Bitcoin from exchanges reflects investor sentiment wanting to accumulate and hold long-term rather than sell, contributing to reduced selling pressure and strengthening short-term price recovery prospects.
Compared to previous deep market declines, outflow from exchanges serves as a warning signal of potential price reversals when supply is restricted.
Are large organizations taking advantage of the price drop?
For example, Metaplanet — an investment organization — has purchased an additional 463 BTC equivalent to 53.7 million USD at the current price level, seizing the drop to accumulate reserves.
Large institutions often act early, taking advantage of price corrections to increase their holdings, laying the groundwork for recovery waves when overall sentiment improves.
CoinGlass report, 2025
This trend is similar to the investment strategies of Bitcoin whales and large organizations, as seen in previous years when they bought during market panic, creating a ripple effect to retail investors and contributing to the often-seen mid-term bullish cycle of Bitcoin.
The buying ratio of institutions increases significantly during market bottoms, serving as a solid indicator of recovery expectations while drawing retail traders' attention to the current price level as a safer accumulation opportunity.
What indicators agree or conflict with Bitcoin's price movements?
Although TD Sequential and technical models support a recovery, the Supertrend on the 4-hour chart still indicates a bearish signal, while the 1-hour chart has shifted to bullish, indicating a mixed trading state.
This 'chop zone' state signals that the Bitcoin market has not established a clear trend, making it easy for pullbacks or strong fluctuations to occur in the short term. Traders need to consider combining multiple indicators and money flow data to enhance the probability of accurately predicting the trend.
The history of the cryptocurrency market also shows that after divergence signals, Bitcoin often goes through an accumulation phase, followed by establishing upward waves when technical indicators and money flow become more clearly aligned.
Comparison table: Outflow from exchanges and its impact on Bitcoin price
Time of BTC withdrawn from exchange (USD) Price fluctuation in the next 7 days (%) Notes March 2024 21 million +4.2 Mild recovery after buy signal August 4, 2025 18.84 million Monitoring Accumulation explosion November 2022 15 million -2.5 Negative sentiment, capital withdrawal for precaution
The table above illustrates: When the outflow of Bitcoin from exchanges reaches a high level and coincides with reversal technical indicators, the probability of price recovery in the coming week tends to increase — except during serious FUD periods.
How does the current recovery model compare to previous upward waves?
The current recovery wave shares many similarities with strong recovery phases of Bitcoin that occurred after technical signals when whales and large organizations heavily bought, for example, in early 2024 or March 2023.
The difference this time is the divergence of technical indicators and decreasing trading volume, indicating that buyers are still cautious even though institutional money has entered. This development could lead to a sideways accumulation phase before a clear upward wave develops.
Many analysis reports from Glassnode in 2024 indicate: After the initial weak recovery phases when buy signals appear, the market often needs to cleanse positions and confirm through holding money flow before breaking out strongly.
What outlooks and risks should investors be aware of?
The growth potential of Bitcoin to 118,000 USD depends on maintaining the momentum of buying money flow, the consensus of technical signals, and the market sentiment not being influenced by uncertain news.
Bitcoin's price is very sensitive to institutional money flow and significant position fluctuations on exchanges, so investors need to combine multiple indicators and strictly manage risk during this sideways phase.
CryptoQuant report, 2025
The main risks include: unpredictable volatility from high Long positions that could be liquidated if prices reverse, unexpected FUD, or macro policies having a strong impact on the digital asset market.
Investors should consider capital management strategies, closely monitor institutional money flow signals, and adjust profit expectations in line with the actual market volatility.
Frequently asked questions
From which significant signal did Bitcoin's price bounce?
Bitcoin's price just bounced after the TD Sequential indicator issued a buy signal on the 12-hour chart, confirmed by expert Ali Martinez.
Is the decrease in trading volume a negative sign?
The decrease in trading volume when prices rise suggests a divide in investor sentiment; however, the technical structure still supports accumulation and recovery potential.
Where is the Long/Short ratio for a bullish Bitcoin market?
A Long/Short ratio exceeding 1.5 on Binance usually reflects strong price recovery expectations from traders.
What does the outflow of money from exchanges signify?
When a large amount of Bitcoin is withdrawn from exchanges, this is a strong accumulation signal, and investors expect to hold and grow in the long term.
Which organization bought the most during this decline?
Metaplanet has purchased an additional 463 BTC worth 53.7 million USD during the recent price drop, demonstrating confidence in recovery prospects.
Will Bitcoin break out immediately or still adjust?
Bitcoin is still in a hesitant trading zone (chop zone), and investors should wait for further confirmations from money flow and technical indicators.
What is the biggest short-term risk?
The biggest risk is that trading positions are too tilted towards Long, which could lead to strong liquidations if prices reverse. Risk management is a key element.
Source: https://tintucbitcoin.com/rut-188-trieu-usd-ca-voi-tro-lai/
Thank you for reading this article!
Please Like, Comment, and Follow TinTucBitcoin to stay updated with the latest news about the cryptocurrency market and not miss any important information!
