-----Web3 Caution: Trading requires caution; long-term gains come from careful strategies; this document does not constitute financial advice.
Let's start with a little story about web2 and web3: Xiao Wang's Web2 nightmare vs Web3 dawn
Scenario 1: Web2 Data Black Box—Xiao Wang is going crazy trying to make an AI model
Xiao Wang (Web2 Developer): Wants to train an AI to predict cryptocurrency prices, but the data is monopolized by the giants.
He needs to buy Google Cloud services and spend a lot of money accessing scattered exchange data;
Data cleaning took 3 months, and the model's predictions were completely wrong due to data lag;
The platform takes a 30% cut, and user data is secretly sold to advertisers.
The outcome: Xiao Wang went bankrupt, and the giants reaped all the data dividends.
Scenario 2: Web3 Data Cooperative—Xiao Li took off from @Chainbase Official
Xiao Li (Web3 Developer): Using Chainbase to create a similar AI model.
Free access to real-time data from over 200 chains (Ethereum, Solana updates in seconds);
Call the AI assistant Theia to check data in plain language: “Recent movements of Bitcoin whales?”—5 seconds to output analysis charts;
Upload self-developed data scripts to earn $C tokens; every time someone calls it, he gets a share of the profit;
After the model was open-sourced, the community voted to award him an additional 100,000 $C in rewards.
The outcome: Xiao Li became a data giant and earned passive income effortlessly.
What exactly is chainbase? It is 'turning fragmented blockchain data into chocolate that AI can consume,' and then using token $C to incentivize everyone to co-build and share a data supermarket.
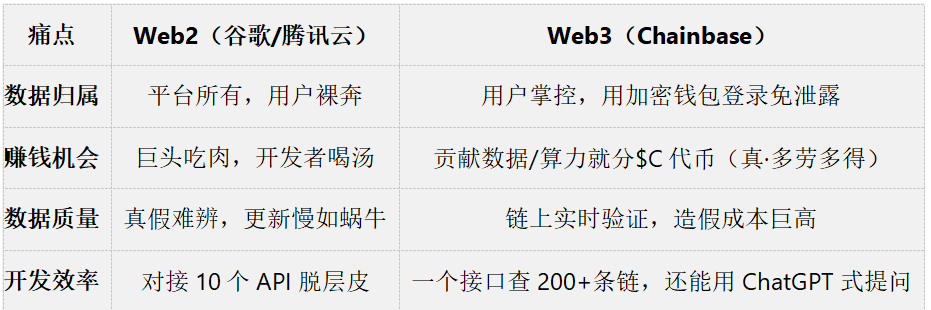
Why must we use Web3? I created a chart comparing data ownership, profit opportunities, data quality, and development efficiency in simple language.
Of course, the governance token of the project is also very important; yes, the price-volume equation is back. Functional analysis, infinite-dimensional space, covariant differentiation, chaotic dynamics, kernel decomposition, simplicial decomposition, Banach space... Behind everything is mathematics; many big shots in the community I built are gradually starting to emerge, including Binance scientists, security experts, mathematicians, etc.
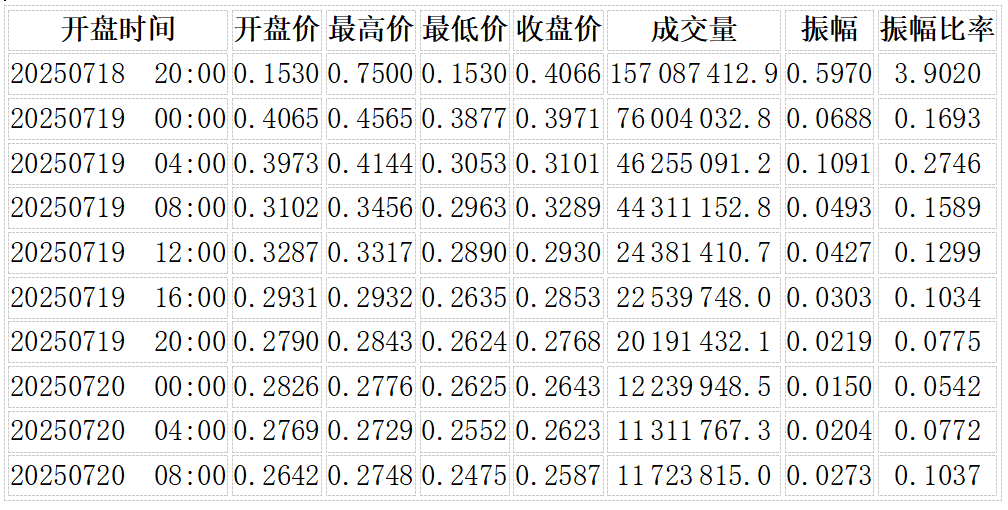
First manually count the 4-hour K-line data of $C which includes opening time, opening price, highest price, lowest price, closing price, trading volume, amplitude, and amplitude ratio, only showing 10 rows of data, while the rest of the data is still output through a lattice discrete graph written by consulting a professor from the university mathematics department.
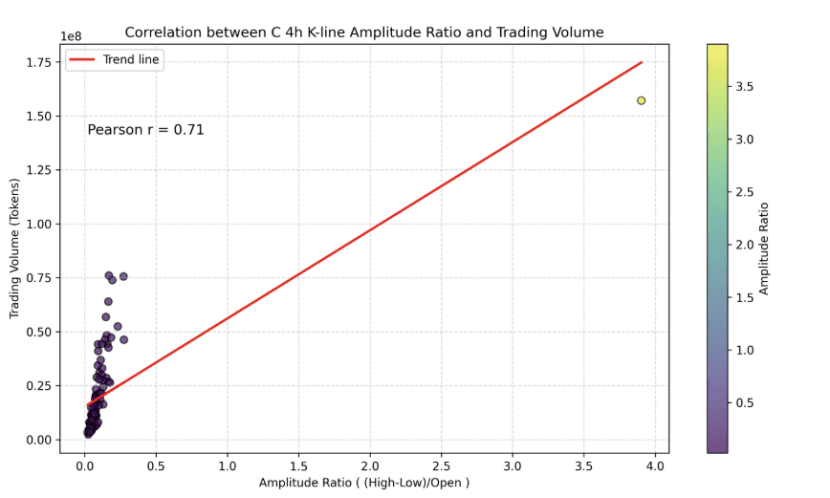
The above chart shows the relationship between the amplitude ratio of token $C and trading volume. The red line is the linear fitting trend line, and the Pearson correlation coefficient (approximately 0.71) is given in the upper right corner, clearly showing the positive correlation between amplitude ratio and trading volume:
Amplitude and trading volume: The Pearson correlation coefficient is approximately 0.81, indicating a high positive correlation between trading volume and price volatility; when the amplitude expands, the trading volume usually increases significantly.
Amplitude ratio and trading volume: The correlation coefficient is approximately 0.71, indicating that even when measured proportionally, higher volatility generally corresponds to larger trading volumes.
Amplitude and closing price: The correlation coefficient is approximately 0.37; the correlation coefficient between amplitude ratio and closing price is approximately 0.25, indicating only a moderate to weak correlation between price and volatility.


