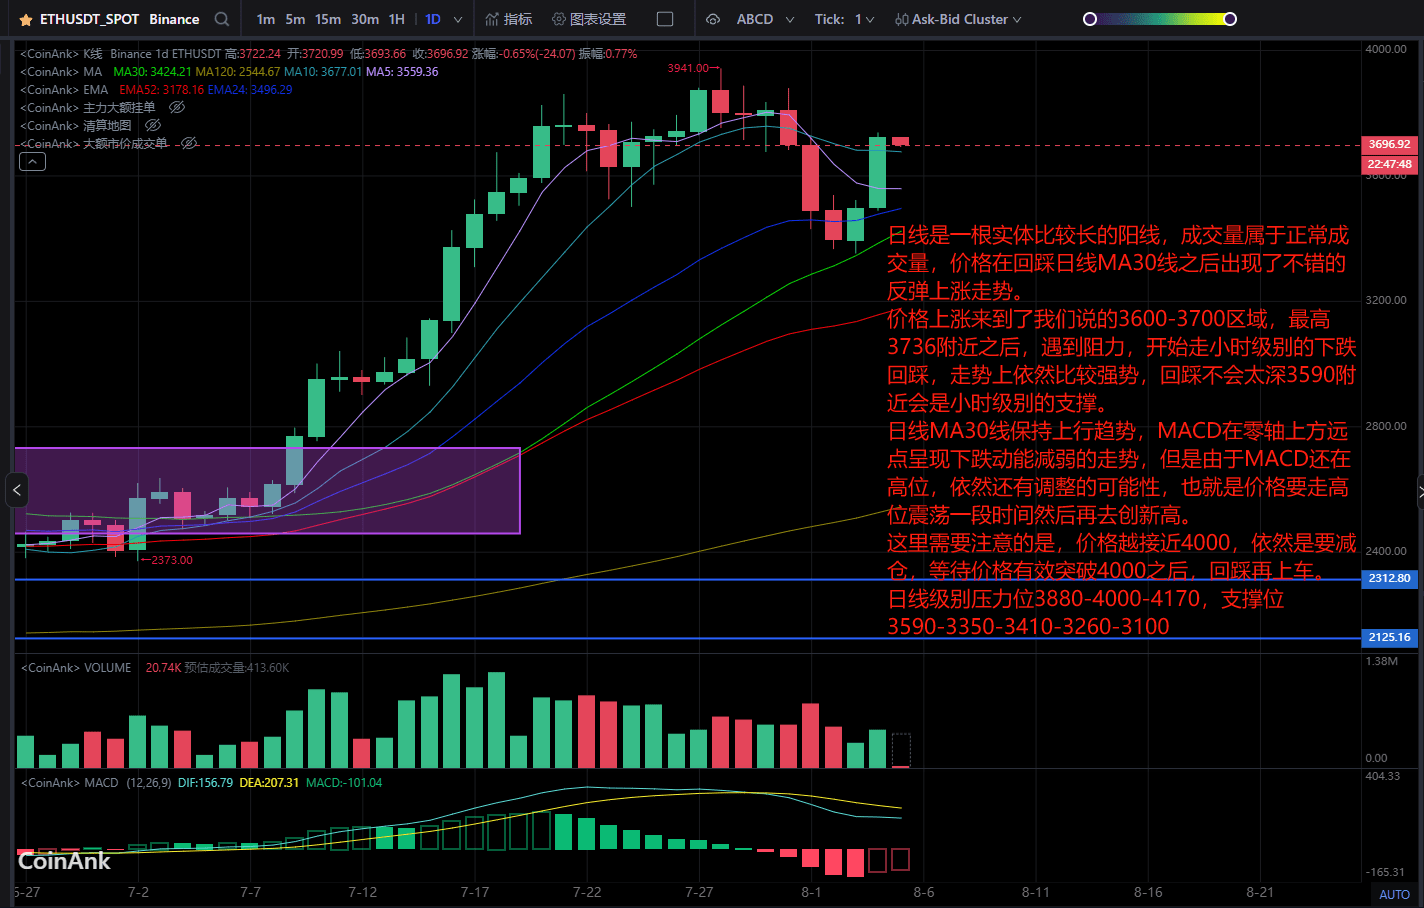
The daily chart shows a long bullish candlestick with normal trading volume. After pulling back to the daily MA30 line, the price has shown a good rebound and upward trend.
The price has risen to the 3600-3700 area we mentioned, peaking near 3736, but has encountered resistance and started a downward correction at the hourly level. The trend remains relatively strong, and the correction will not be too deep; around 3590 will serve as support at the hourly level.
The daily MA30 line maintains an upward trend, and the MACD shows a weakening downward momentum above the zero line. However, since the MACD is still at a high level, there is still a possibility of adjustment, meaning the price will oscillate at a high level for a period before reaching a new high.
It is important to note that the closer the price gets to 4000, the more one needs to reduce positions, waiting for a valid breakout above 4000 before re-entering after a pullback.
Daily level resistance is at 3880-4000-4170, and support is at 3590-3350-3410-3260-3100.