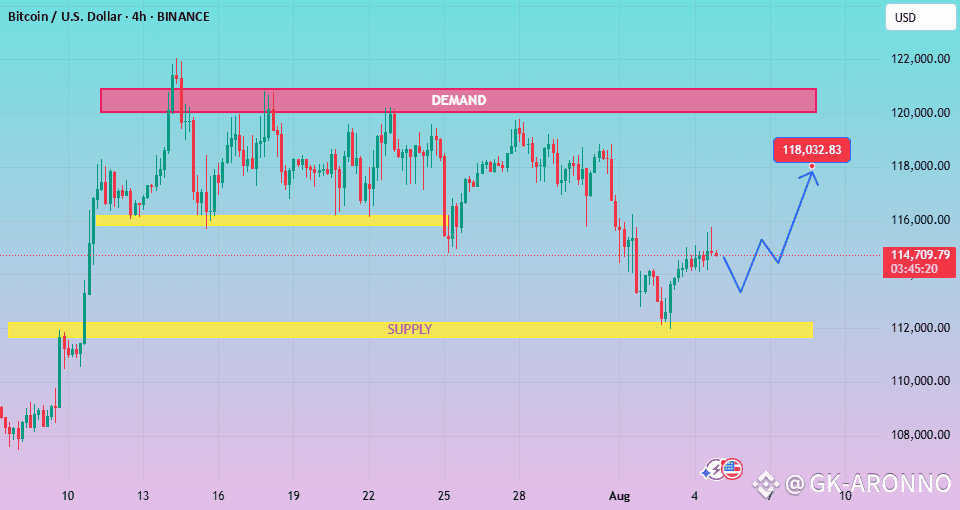
Bitcoin appears to be forming a short-term bullish structure after bouncing from a support zone around $112,000–$113,000, which is clearly marked on the chart in yellow.
Key Observations:
Support Zone (Yellow): This area has acted as a base for a potential reversal. Strong buying interest has historically emerged from this level.
Demand Zone (Red): Around the $118,000–$120,000 level, there's a marked demand/resistance zone where previous bullish moves have been rejected.
Projected Move (Blue Path): The chart includes a projected bullish path, suggesting a continuation toward the demand zone. This indicates that the trader is expecting upward momentum.
Volume Activity: There's consistent volume, though no major spikes—suggesting steady interest rather than high volatility.
Indicators (not shown in detail): While specific indicators aren’t visible in the screenshot, the price structure implies price action and support/resistance analysis are being used primarily.
Conclusion:
Bitcoin is currently rebounding from a well-defined support zone with potential to test resistance around $118K–$120K. A break above this area could signal further bullish continuation, while rejection could lead to a retest of lower levels. Traders should monitor volume and price behavior around key levels for confirmatio