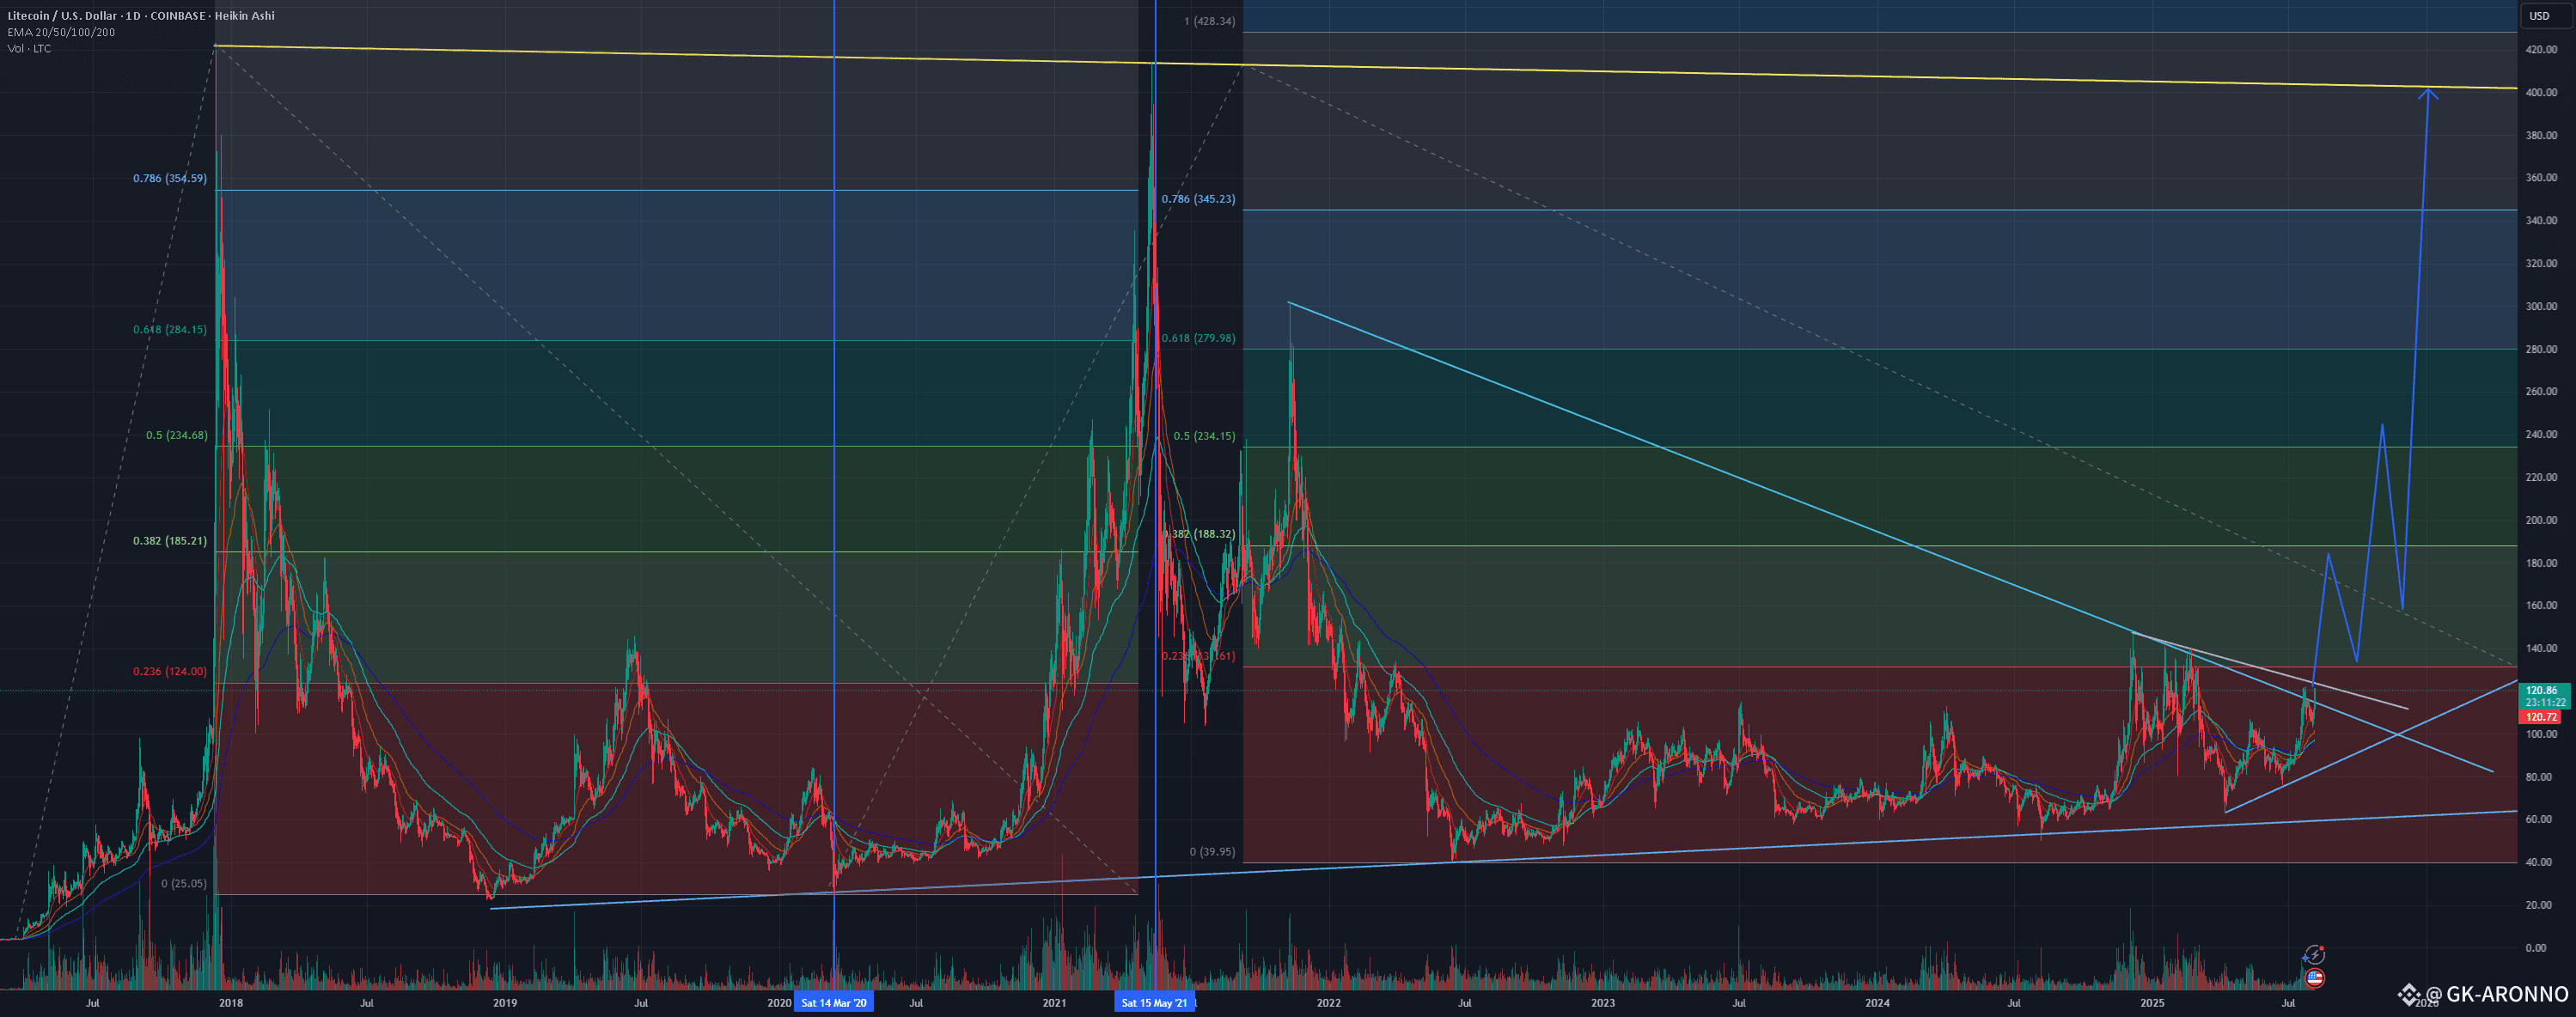
Observing the price action between the two vertical blue lines (the '20 to '21 bull cycle), and comparing to the trend based fib extension levels on the left, we have a blueprint for the fib levels that LTCUSD responds to. At the .236 fib, a 24% pullback. At the .382 a 36% pullback. At the .5 a 38% pullback. Then the market got super heated and it blew past the .618 and had another 38% pullback before the final push up to $413, followed by a 75% "correction".
I'm using those fib levels for my sell/buyback zones in the current bull cycle:
- The first one is at $131, but I think LTC may blow past this one since it's so close to where LTC is breaking out of the trendline and the crypto market just had a retrace.
- The second level is at $188.
- Third level at $234.
- The final level I'm aiming for is the golden trend line at around $400.
- Based on breaking out of the long descending wedge on the LTC:BTC chart, it's possible for LTCUSD to have a huge blow-off top and hit upwards of $600.
Looking at the LTC:BTC pair, (see my last post), Litecoin has a huge potential in the current bull cycle. In the '20-'21 cycle it didnt breakout against bitcoin until the end of the bull run and that breakout wasn't major. LTC:BTC is currently breaking out of a long-term trendline with significant volume.
We'll see. But one thing is for sure, LTC held up well against BTC during the recent drop from $119k to $112k, and now it's pumping steadily. Lookin' good.
What do you think?