Firstly, our Algo-based indicators are used to create this analysis. Follow me so you don't miss, Boost and leave your comments if you profited with our posts, so we may continue:
This 9-hour chart for KAITO/USDT highlights a compelling long trade setup originating from a critical support level, suggesting the potential for a significant rally.
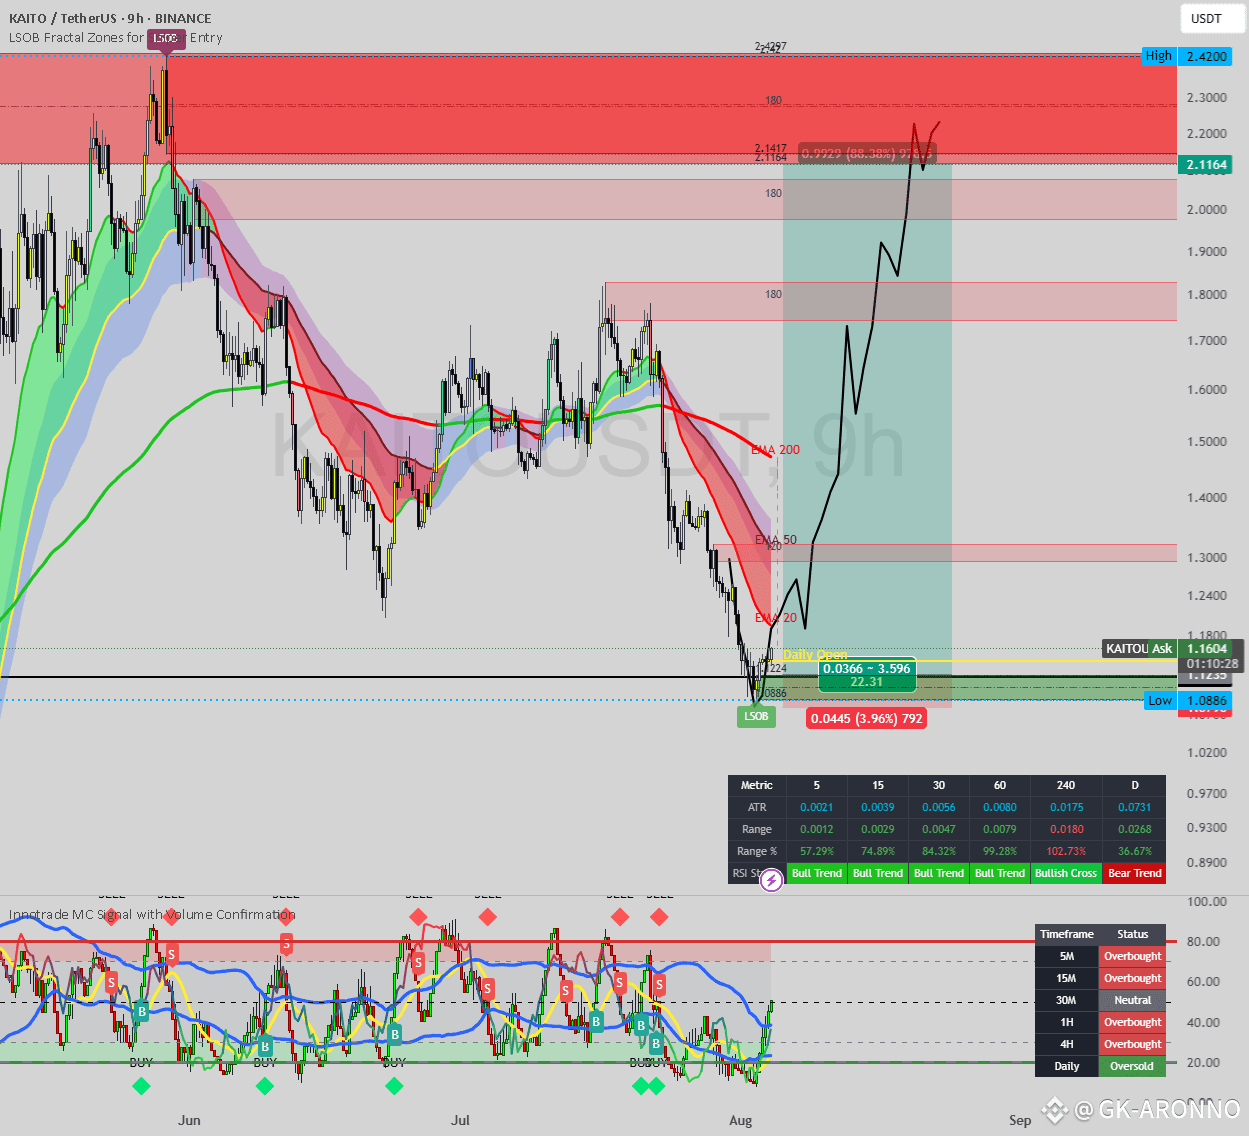
Key Support Bounce: The price has found strong support and reversed from a key "LSOB" (Liquidity Sweep Order Block) zone, with the low established at $1.0886. This type of level often marks significant turning points where liquidity is hunted before a move in the opposite direction.
Indicator Confirmation: The custom indicator at the bottom of the chart strongly supports a bullish reversal. It shows the price moving sharply out of the deep oversold "BUY" zone. Furthermore, the "Daily" timeframe status is marked as "Oversold," adding significant weight to the potential for a strong bounce or trend reversal.
Entry: Around the current price levels (~$1.16).
Stop Loss: Tightly placed just below the recent low at approximately $1.0886.
Take Profit: The primary target is set at $2.1164, which aligns with a major resistance zone.
Risk/Reward: This setup presents an exceptional risk-to-reward ratio of approximately 22:1, with a potential gain of over 88%.
Strategy:
The illustrated black line projects a strong rally from the current accumulation zone. The move is expected to break through intermediate resistance levels around $1.30 and $1.80 before pushing towards the final target.
Conclusion:
The confluence of a bounce from a major liquidity zone, strong confirmation from oversold indicators, and a well-defined trade setup with a massive risk-to-reward ratio makes this a very compelling bullish scenario for KAITO/USDT.
Disclaimer: This analysis is for educational purposes only and should not be considered financial advice. Always conduct your own research and manage risk appropriately.