
Bitcoin is currently trading at important levels after a sharp drop to the $112,000 range, causing panic among investors worried that this could signal the start of a broader bear market. After several weeks of tight accumulation, the sudden drop has raised concerns about a deeper correction, especially as short-term holders (STH) are forced to accept losses or hold short positions.
However, not all analysts are sounding the alarm. Leading analyst Axel Adler argues that although the market is going through the final stage of a typical bull cycle, the overall uptrend remains intact. Adler points out that as the bull market matures, investors' risk appetite naturally decreases, leading to increased profit-taking and short-term selling pressure. This creates temporary obstacles but does not necessarily signal a trend reversal.
Long-term holders (LTH) are still holding strong profits, showing no signs of capitulation. Their confidence continues to be a supportive foundation for Bitcoin's price structure. This is a normal phase of the bull market, where short-term volatility shakes out weaker holders before continuing.
Maturing Cycle of Bitcoin's NUPL and MVRV Signals
According to Adler, the harmonized average value of Bitcoin's NUPL (Net Unrealized Profit/Loss) and MVRV (Market Value to Realized Value) shows a clear shift in investor behavior as the growth cycle matures. Adler's data shows that in March and December 2024, this combined index peaks above 1.9, marking a market phase with strong confidence, as investors continue to hold despite high profit margins.
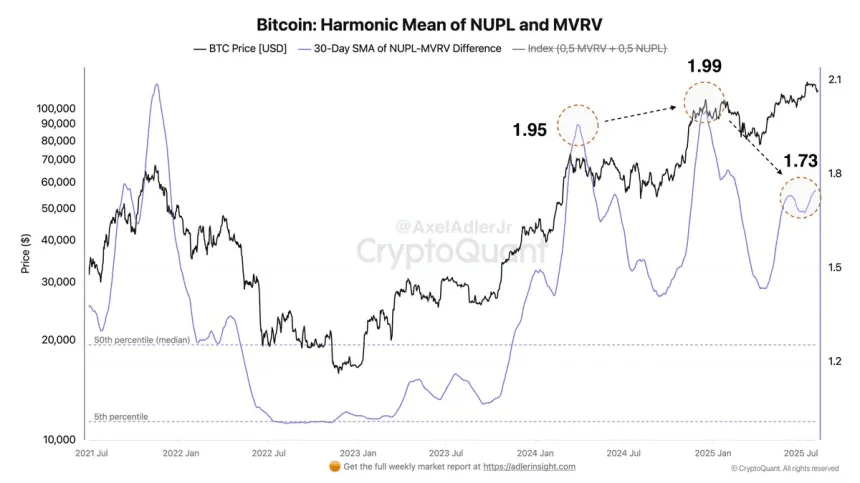
However, current indicators show a significant decline, with the moving average forming a lower peak, signaling that holders are more inclined to realize profits rather than hold through new price increases. Adler points out that each current price increase yields a smaller margin compared to the holders' cost basis, leading to increased selling pressure as the market struggles to maintain higher valuations.
This does not mean that the bull market has ended, but it indicates that investors' risk appetite is gradually diminishing. Profit-taking is gradually overshadowing new demand, which could limit future price increases.
However, Adler expects two more significant price increases in this cycle, driven by macro factors such as two anticipated interest rate cuts by the Federal Reserve at the end of this year. These events could reignite market momentum and push Bitcoin to new highs. However, Adler warns that after these final price increases, selling pressure from long-term holders may outweigh new demand, leading the market into a broader correction phase.
Price Analysis: Examining Resistance Levels After Breakout
Bitcoin (BTC) is currently trading at $114,690, trying to recover after a sharp drop below the support level of $115,724, which is now acting as resistance. The daily chart shows BTC forming a slight recovery after hitting a local low of $112,200, with price action consolidating around the 50-day Simple Moving Average (SMA) at $112,218. This moving average has provided strong support in the recent correction, preventing deeper declines towards the $110,000 level.
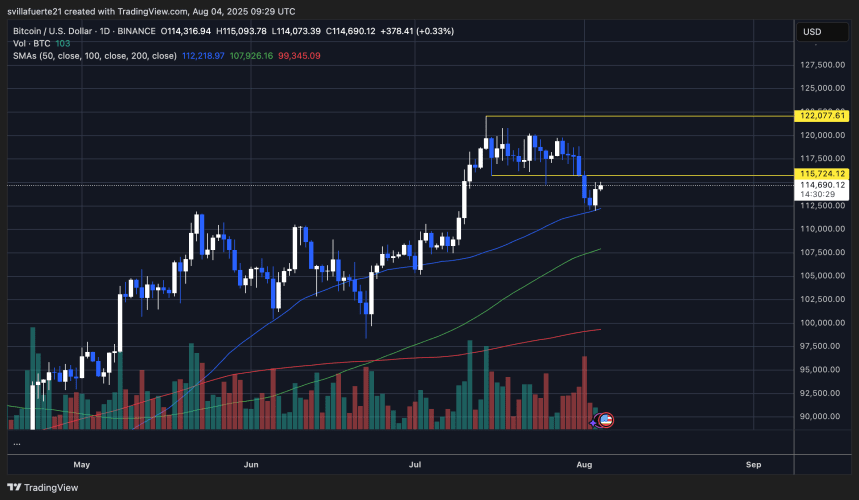
The next important level to watch is the resistance level of $115,724. A close above this level will signal the potential for prices to return to previous price ranges, increasing the likelihood that prices will retest the local peak of $122,077. However, if BTC cannot convincingly surpass this level, it may indicate that sellers still maintain control, leading to the possibility of prices retesting the 50-day SMA support level. Trading volume remains low compared to previous price increases, indicating a lack of strong buying momentum. The 100-day SMA at $107,926 and the 200-day SMA at $99,345 remain important dynamic support levels if bearish pressure continues to emerge.