Understanding candlestick patterns is one of the most powerful tools a cryptocurrency trader can master. These patterns provide insight into market sentiment, potential reversals, and price movements — often before indicators catch up.
🔍 What Are Candlestick Patterns?
Candlestick patterns are visual representations of price movements within a specified time frame. Each candlestick displays four key data points:
Open
Close
High
Low
The body of the candle reflects the range between the opening and closing prices, while the wicks (or shadows) show the highs and lows. In crypto, green candles usually indicate bullish (upward) momentum, while red candles show bearish (downward) movement.
🧭 Why Candlestick Patterns Matter in Crypto
Cryptocurrency markets are volatile, and traditional technical indicators may lag during fast movements. Candlestick patterns offer real-time signals that can alert traders to:
Reversal zones
Continuation trends
Market indecision
Potential breakouts or breakdowns
📊 Basic Candlestick Patterns
Here are some of the most important single-candle and multi-candle patterns:
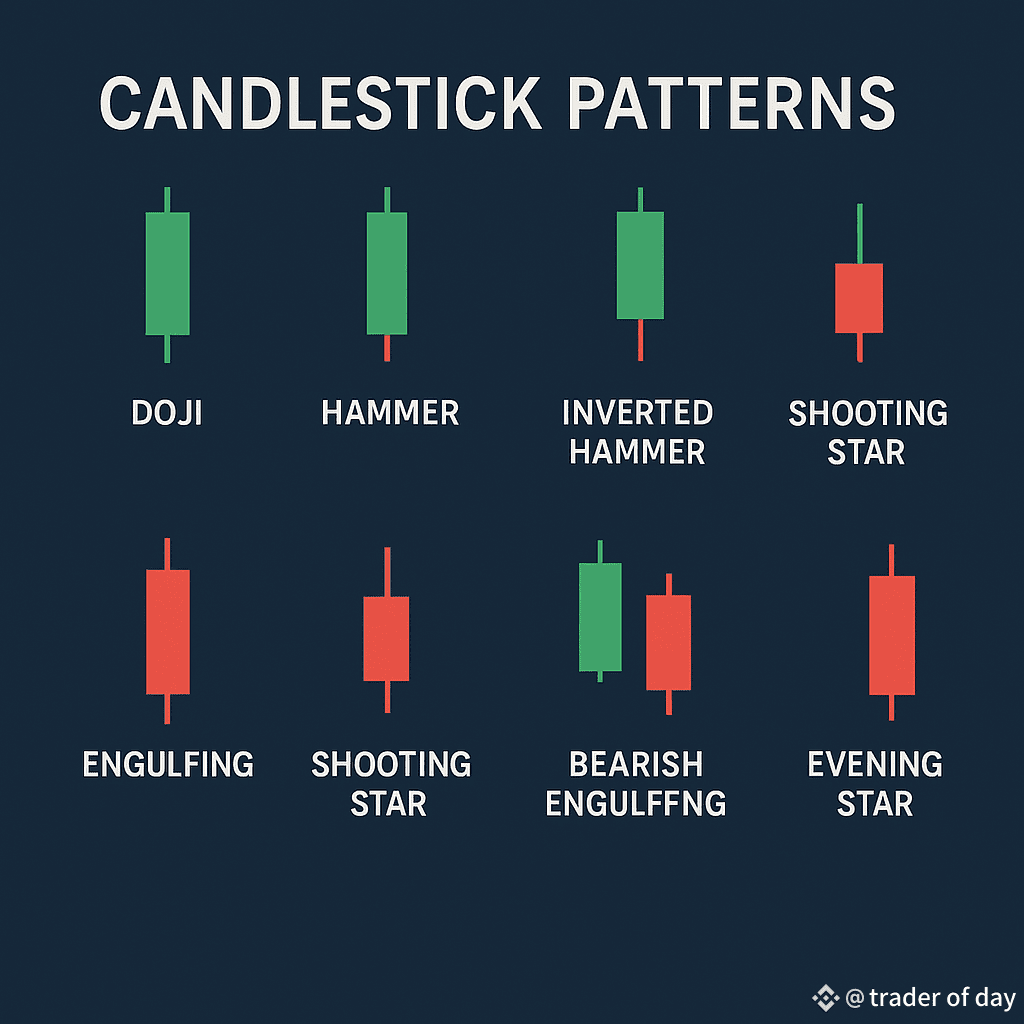
✅ 1. Doji
A Doji forms when the open and close prices are nearly identical, indicating indecision. It’s a sign of a possible trend reversal when appearing after a strong move.
✅ 2. Hammer & Inverted Hammer
Hammer: Found at the bottom of a downtrend, has a small body and long lower wick. Indicates bullish reversal.
Inverted Hammer: Similar, but with a long upper wick. Also suggests reversal but with weaker confirmation.
✅ 3. Shooting Star
Appears at the top of an uptrend with a small body and long upper wick. It hints at a potential bearish reversal.
✅ 4. Engulfing Patterns (Bullish & Bearish)
Bullish Engulfing: A green candle fully engulfs the previous red candle. Signals a strong upward reversal.
Bearish Engulfing: A red candle engulfs a green one, indicating potential downside.
✅ 5. Morning Star & Evening Star
These are three-candle reversal patterns.
Morning Star: Bullish reversal after a downtrend.
Evening Star: Bearish reversal after an uptrend.
🛠 Using Candlestick Patterns with Confirmation
Patterns should never be used alone. Combine them with:
Volume analysis
Support & resistance levels
RSI or MACD indicators
Confirmation increases the accuracy of your trade entries.
🧠 Tips for Using Candlestick Patterns in Crypto
1. Use longer timeframes (1H, 4H, Daily) for stronger signals.
2. Always wait for candle close — don’t act mid-pattern.
3. Combine candlestick analysis with market context (news, trends).
4. Backtest patterns on different coins to see how they react.
⚠️ Common Mistakes to Avoid
Over-relying on a single pattern without confirmation
Trading on low-volume charts, which may create false signals
Ignoring larger trends (a bullish pattern in a strong downtrend may fail)
🚀 Final Thoughts
Candlestick patterns are a powerful visual tool for crypto traders. They offer insights into market psychology and can be the difference between catching a
trend early or entering too late. With practice, pattern recognition becomes a reflex — helping you make faster and smarter trading decisions.
