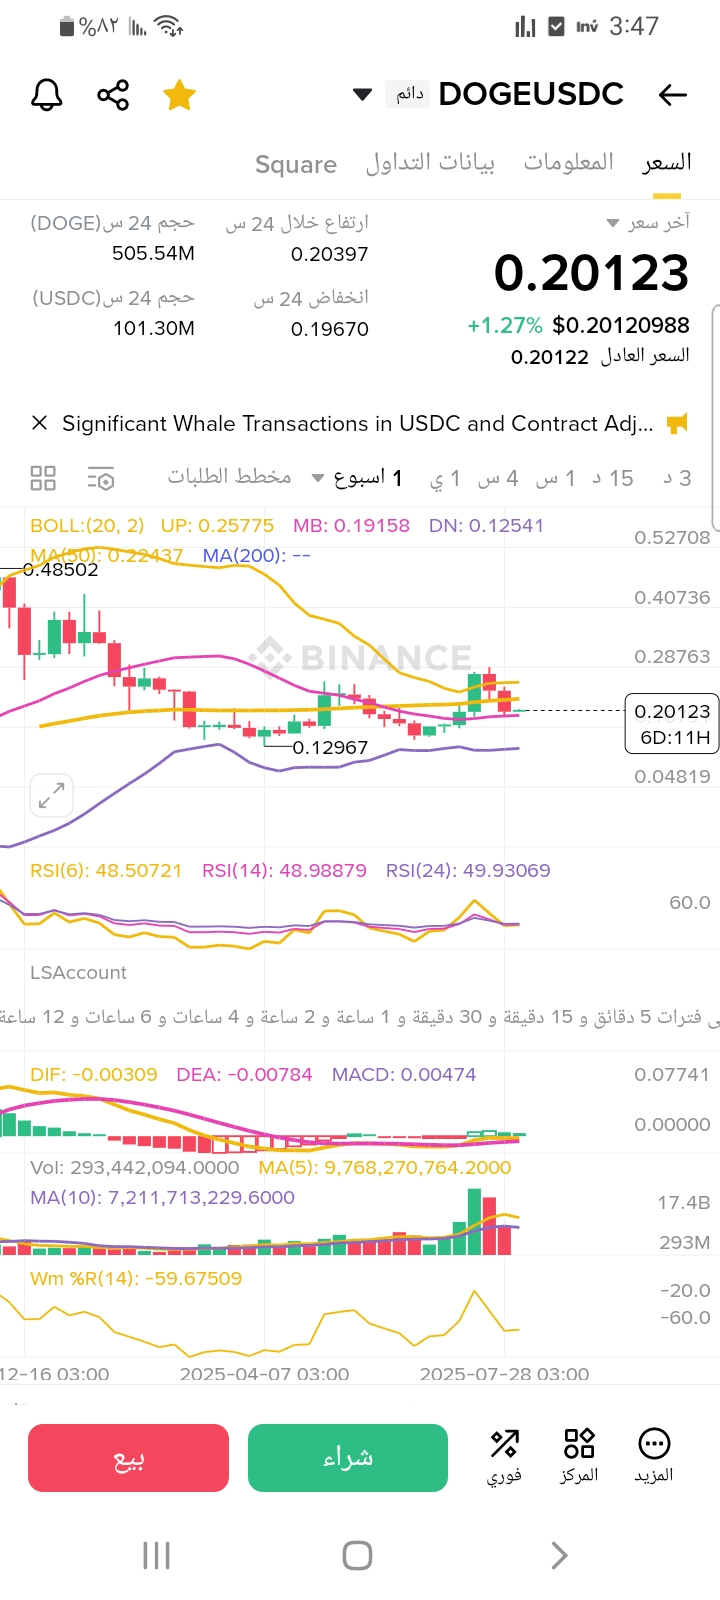
🎯 Current price:
0.2012 dollars
🔍 Technical analysis on the 4-hour timeframe:
✅ Technical indicators:
RSI (Relative Strength Index): Around 48 – Neutral inclined upwards, has not reached the overbought area.
MACD: There is a slight positive crossover but it is still weak (uncertain).
Recent candles: A bullish reversal candle appeared at the support of 0.197, supporting the possibility of a temporary bounce.
Volume (trading size): Low, indicating a weak or unsustainable bounce unless it increases.
📈 Support and resistance levels:
Level Type Importance
0.197 Strong support The price has bounced off it twice
0.202–0.204 Current resistance Price congestion area, breaking it confirms momentum
0.215 Medium resistance Closing a 4-hour candle above it heralds a new rise
0.235 Weekly resistance Breaking it = beginning of a medium-term upward trend
📊 Expected scenarios (short-term)
🔵 Bullish scenario (60% chance)
If the price maintains the support of 0.197–0.20 and manages to close above 0.204 within the next 48 hours.
First target: 0.215
Second target: 0.228
Suggested stop loss: 0.195
🔴 Bearish scenario (40% chance)
If the support of 0.197 is broken with a strong candle accompanied by high trading volume.
First target: 0.185
Second target: 0.172
Stop loss for short sellers: 0.205
🧠 Recommendations:
Trader type Strategy
Quick trader Monitor break of 0.204 – If broken and confirmed by a candle, safely target 0.215
Cautious trader Wait for the price to bounce back to 0.197 again, then buy from the support with a stop loss below 0.194
Short seller Currently not recommended unless there is a clear break below 0.197 with strong momentum, targeting short to 0.185
📅 Summary of expectations for the coming days:
Today General expectation
Monday – Tuesday Fluctuating between 0.197 – 0.204 (Accumulation)
Wednesday – Thursday If 0.204 is broken: a surge towards 0.215
Friday – Saturday Either strong stability above 0.215 (positive) or rejection and return towards the support of 0.197