For beginners entering the cryptocurrency market, mastering some practical trading techniques is crucial. Here is the essence shared by a cryptocurrency winner worth over a hundred million.
1. Select strong coins, using the 60-day line as a guide.
When trading cryptocurrencies, focus on those strong-performing coins. If you're unsure, observe the 60-day line (i.e., the 60-day moving average). When the coin price is above the 60-day line, it's a good time to consider buying or increasing positions; once the coin price breaks below the 60-day line, you should decisively withdraw. This trick is very effective in most cases.
2. Buy at low levels to avoid chasing highs.
When encountering coins that have risen more than 50% overnight, do not rush to chase highs, as this can easily lead to panic. Instead, you should choose to buy in at low levels, as this carries relatively lower risk while the potential returns may be greater.
3. Capture signals before a significant rise.
Before a significant rise in coin prices, there are usually some signals that appear. For example, the coin price will fluctuate within a relatively narrow range, possibly between 10% and 20%, while trading volume decreases significantly. At this time, you can slowly buy in at a low level, and you are likely to catch the upcoming upward trend.
4. Keep up with new market hotspots.
Whenever a new hot topic arises in the market, the first few days are often very explosive. This is a great time to seize profit opportunities. You can follow the flow of large funds to easily achieve profits.
5. Stay calm during a bear market.
Once you enter a bear market, you must control your hands and refrain from making rash moves for at least six months. During poor market conditions, reduce operations and learn to rest. True experts understand the importance of resting at the right time.
6. Regularly review and adjust strategies.
Review your trading records weekly, but focus not on how much money you made, but on whether your trading strategy was correct. If the strategy is correct, stick with it; if it's wrong, adjust in time. Over a few months, your cryptocurrency trading journey will become increasingly stable.
Interpreting chart patterns can often open the door to profits for traders. Today we will delve into the 'Triple Top Chart Pattern,' which is highly regarded by traders for its predictive ability and insight into the psychology of buyers and sellers.
Why do I say this? Because the triple top pattern is stronger and more reliable compared to other trend reversal patterns. The price has failed to break through a key level three times, indicating a stronger resistance or support level.
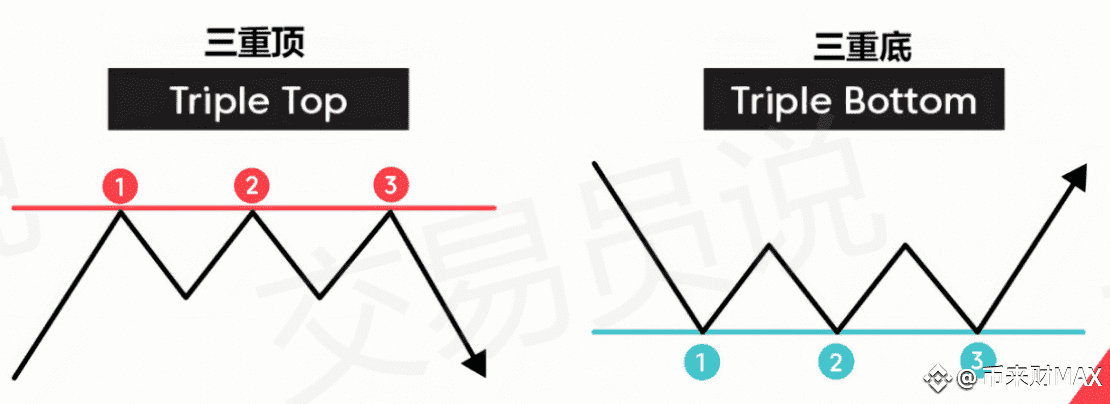
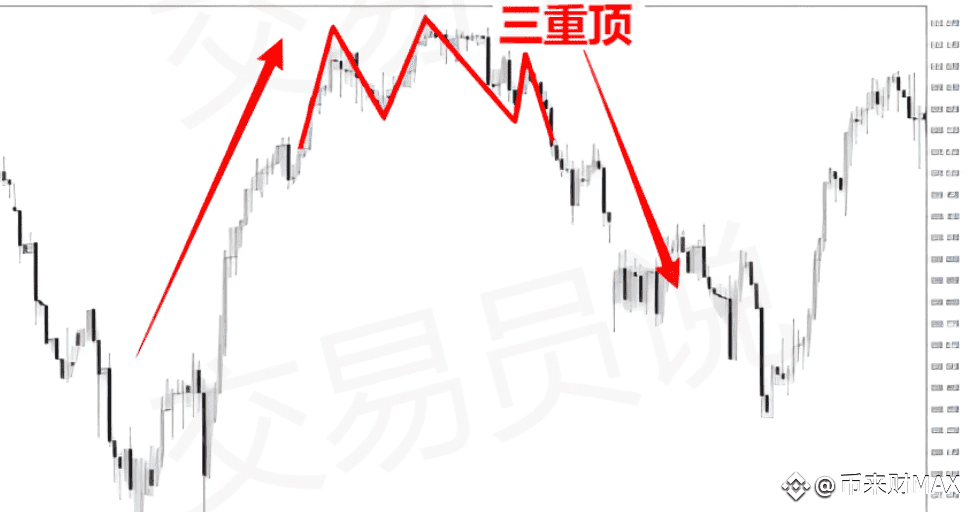
On the chart pattern, the triple top pattern consists of three 'peaks' that almost reach the same price level, indicating that the price may no longer be on an upward trend, suggesting that a downward reversal may occur. Triple tops can appear across all time frames, but they must follow an upward trend to be considered. This chart reversal pattern looks like the letter 'M' on candlestick charts.
In contrast to the triple top, the triple bottom chart pattern looks like the letter 'W,' and this pattern will appear after a downward trend, with three bottoms touching the same price level before breaking the resistance level.
However, it is worth noting that although triple tops and triple bottoms are very reliable, their formation frequency is not high, and they are difficult to sustain.
What is the triple top chart pattern trading strategy?
It is well known that the triple top chart pattern trading strategy is a reversal strategy designed to leverage a simple yet very powerful chart pattern. One of the main advantages of reversal trading strategies is that they give you the opportunity to participate in new trends from the very beginning.
As mentioned above, the triple top pattern may actually take a long time to form, but it reflects the fierce struggle between buyers and sellers.
However, within the intraday trading timeframe, the triple top reversal may occur more frequently, which is why we prefer to day trade using the triple top chart pattern strategy.
What is the triple top pattern?
According to traditional definitions, the triple top pattern is one of many reversal patterns that intuitively represents the transfer of control over the trend.
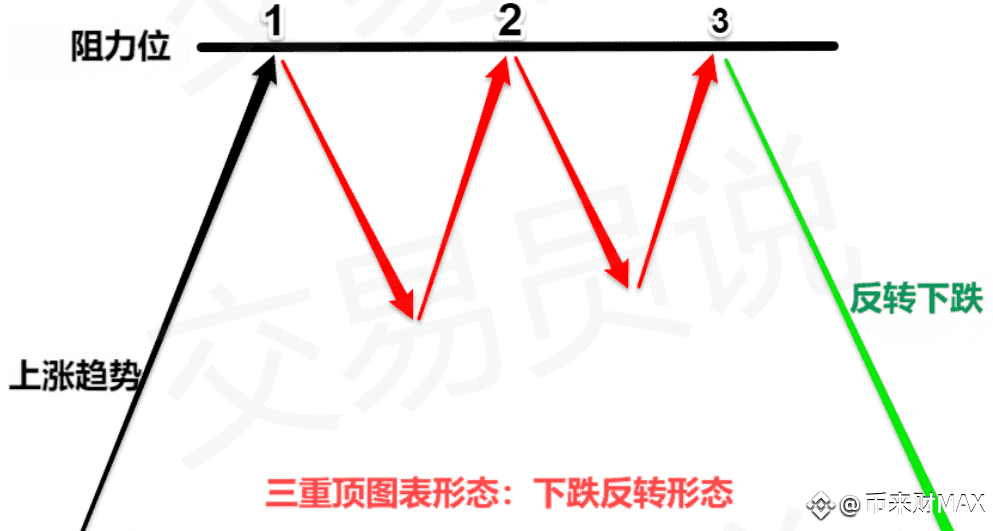
A perfect triple top reversal structure consists of three almost or completely identical price levels, where the market has failed to break through this price level. Moreover, the reaction from the resistance level during the third time indicates that seller interest exceeds buyer interest, and the trend is reversing.
We need to define several rules for the triple top pattern:
◎ Rule 1: A prior trend must exist as a background for a reversal to occur. In the case of the triple top reversal, we need to look for a bullish trend that ultimately enters the area of fluctuating high points, from here enough selling pressure emerges to stop the further development of the upward trend.
◎ Rule 2: The strength of the upward trend may determine the intensity of subsequent sell-offs.
Now, let's delve into the psychological factors behind the triple top reversal.
The psychological mechanism behind the triple top pattern.
The psychology behind the triple top reversal indicates that buyer momentum is gradually feeling exhausted, or they do not have enough strength to push the price higher.
At the same time, sellers become more aggressive as they are ready to trade at higher prices. Ultimately, we reach the balance point of buying and selling power.
The triple top pattern is a more powerful reversal pattern because it has failed to break the resistance level for the third time. More sellers notice the weakness of buyers who are unable to push the price higher, thus they intervene more aggressively and ultimately succeed in pushing the price down.
Note: Public psychology shows that failing to break through the resistance level three times enhances the importance of that level.
Now, let's see how to effectively use the triple top chart pattern trading strategy to profit from it.
How to use the triple top pattern trading strategy.
The triple top pattern rarely appears in higher time frames, which is why we primarily apply the triple top chart trading strategy on intraday charts. Of course, you can also safely use this strategy in higher time frames, but you need a lot of patience because signals are fewer.
Step #1: The triple top reversal consists of three rounded tops.
You need to identify three rounded tops to consider the triple top pattern as tradable. But what is a rounded top?
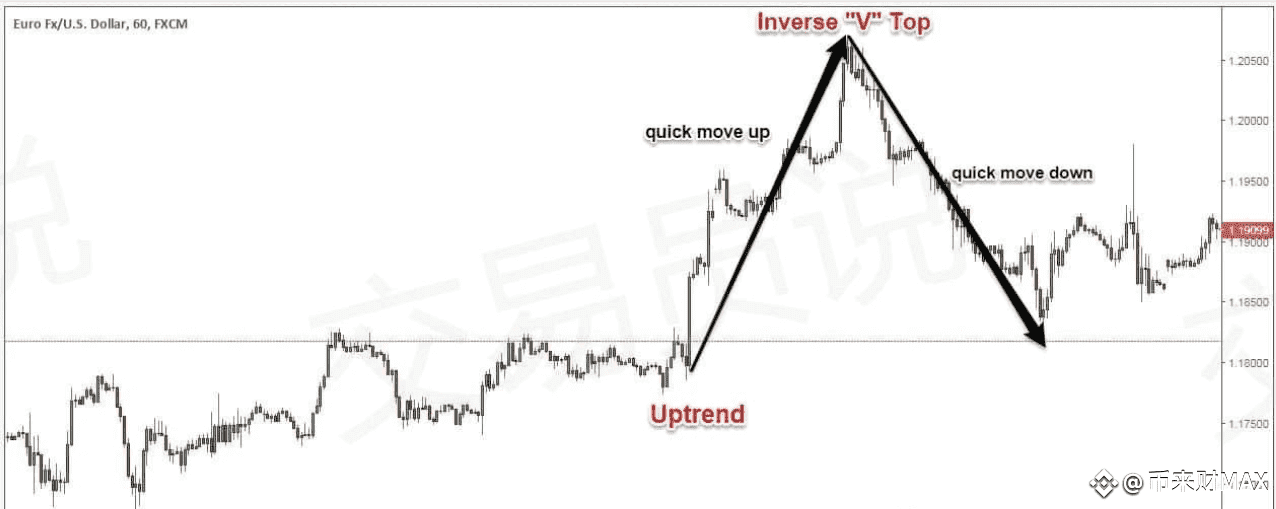
In technical analysis, a rounded top typically occurs after an upward trend; the price first moves up and then quickly falls, forming a dome, sometimes appearing as an inverted 'V.'
According to the structure of the triple top reversal, the size and amplitude of the inverted V top may vary. In any case, the key is that we need to see the price rise rapidly and then fall quickly to define a rounded top.
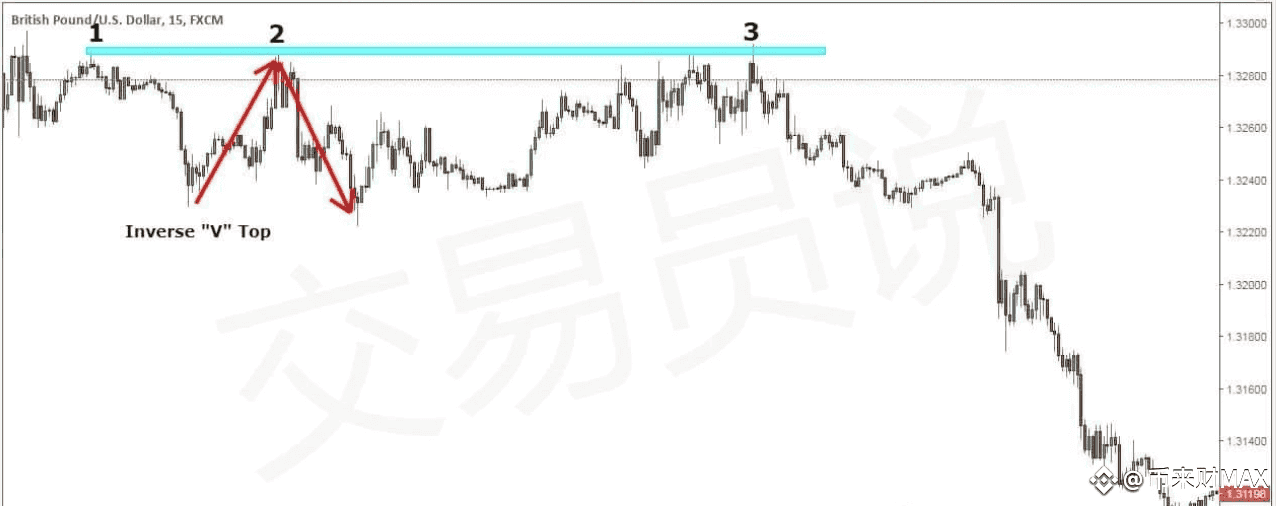
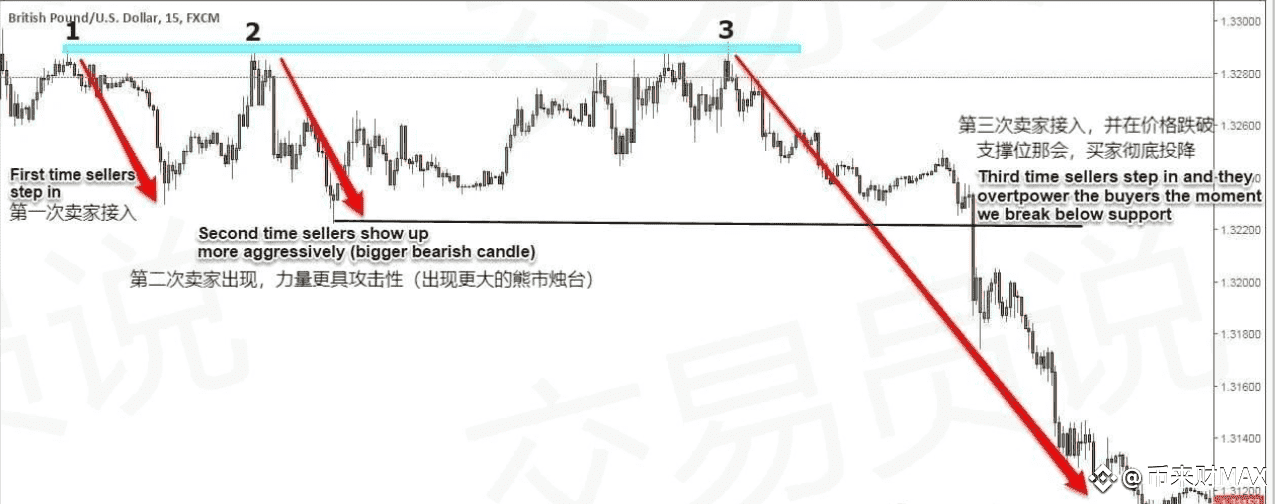
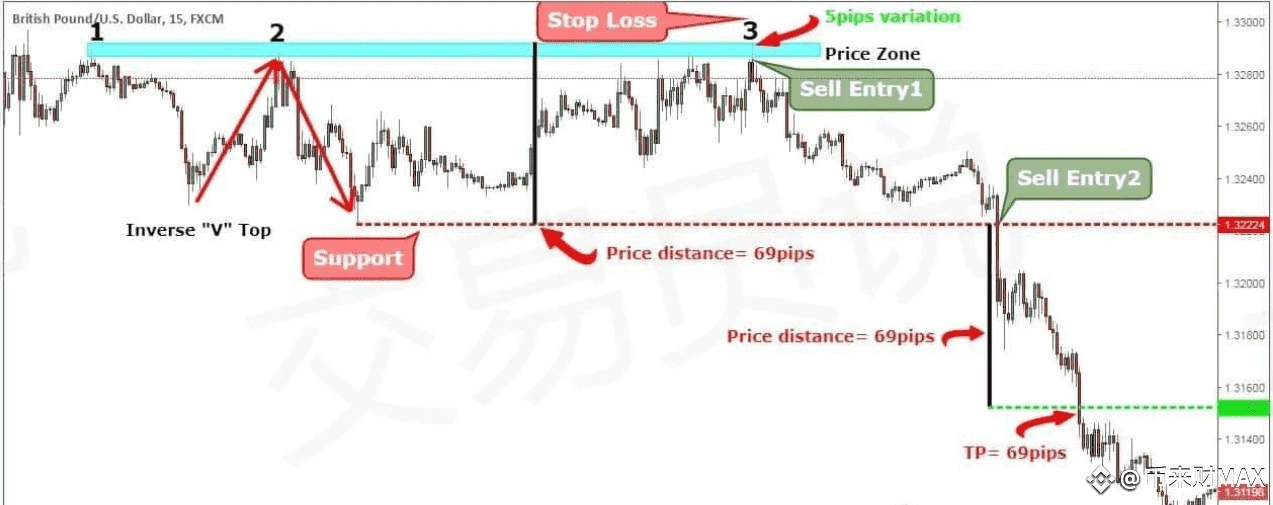
To practice the triple top chart trading strategy, we chose the GBP/USD triple top reversal shown in the above image. It can be noted that in all three tops, the inverted 'V' shape top is presented to some extent.
Note: Do not strive for perfection, because in trading, you need to abandon an idealistic mindset; inverted 'V' tops do not always look perfect, so be flexible.
Step #2: Allow a difference of 10-15 points between the three tops.
The second criterion for a tradable triple top pattern is that a 10-15 point difference must be allowed between the three tops.
What does this mean?
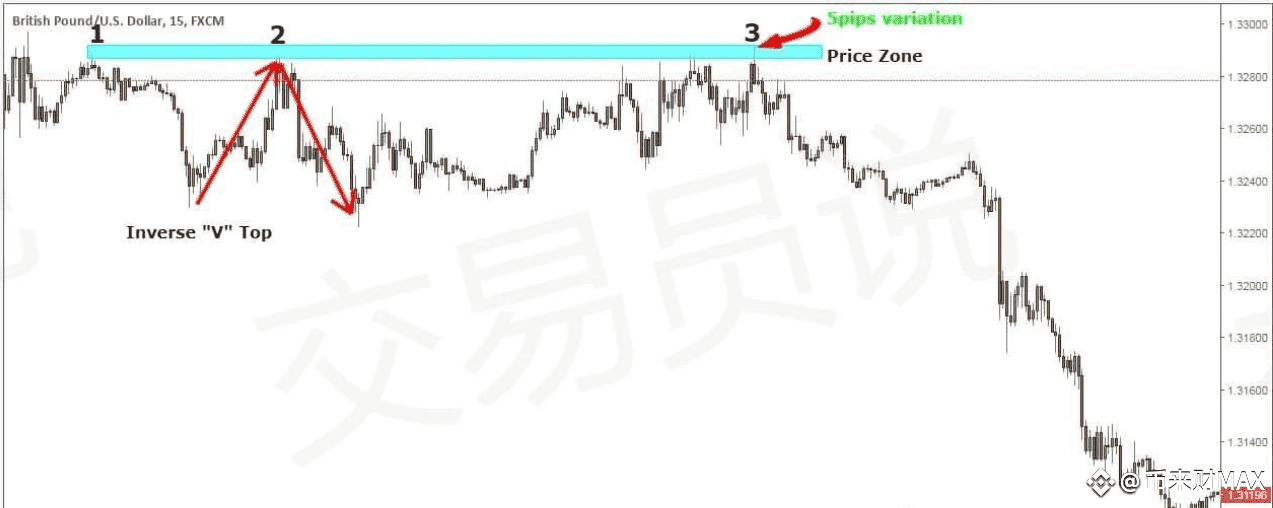
The probability of three tops appearing at the same price level is almost zero. You will find that these three tops usually have slight differences, but they appear near the same price area.
More importantly, the closing price; if the position of the triple top pattern is good, the closing price may align perfectly. This is why we advocate for abandoning an idealistic mindset.
Step #3: Enter at the third resistance test and re-enter when breaking the support.
If you want to take on more risk and are an aggressive trader, you can enter when testing the resistance for the third time, anticipating that the triple top reversal will hold. We prefer to spread the risk by entering half a position on the third retest and entering the other half when breaking the support.
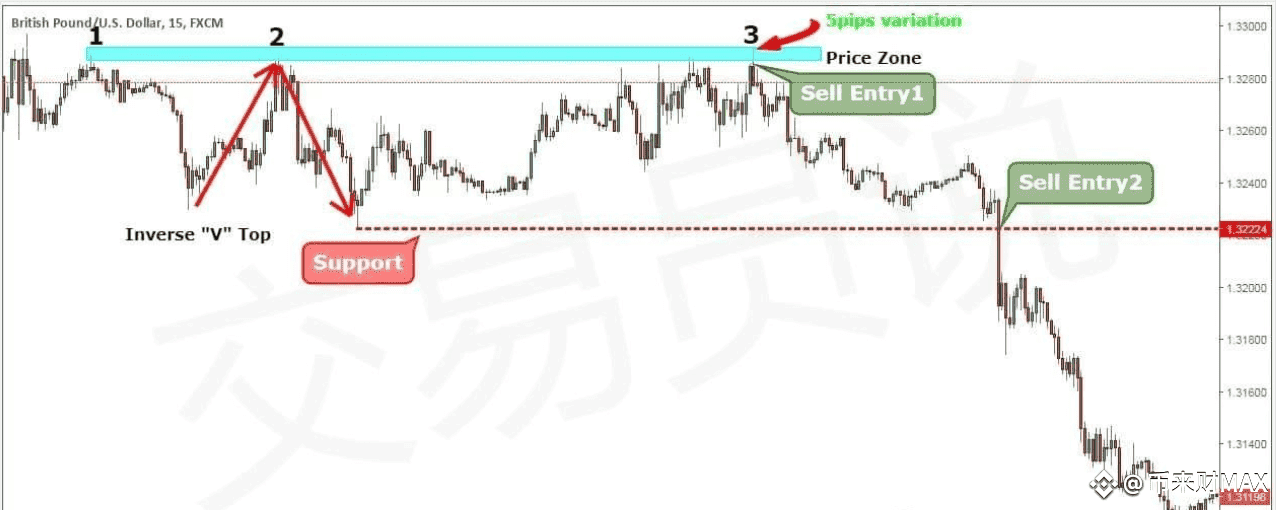
From the perspective of swing trading, you need to see signs of market sentiment shifting from bullish to bearish. This signal can only be provided by breaking through the support level of the triple top reversal.
Note: The support level here is constituted by the bottoms formed during the process of the triple top formation (similar to the 'neckline' of a head and shoulders pattern).
Next, we need to determine reasonable profit points for the triple top chart pattern trading strategy.
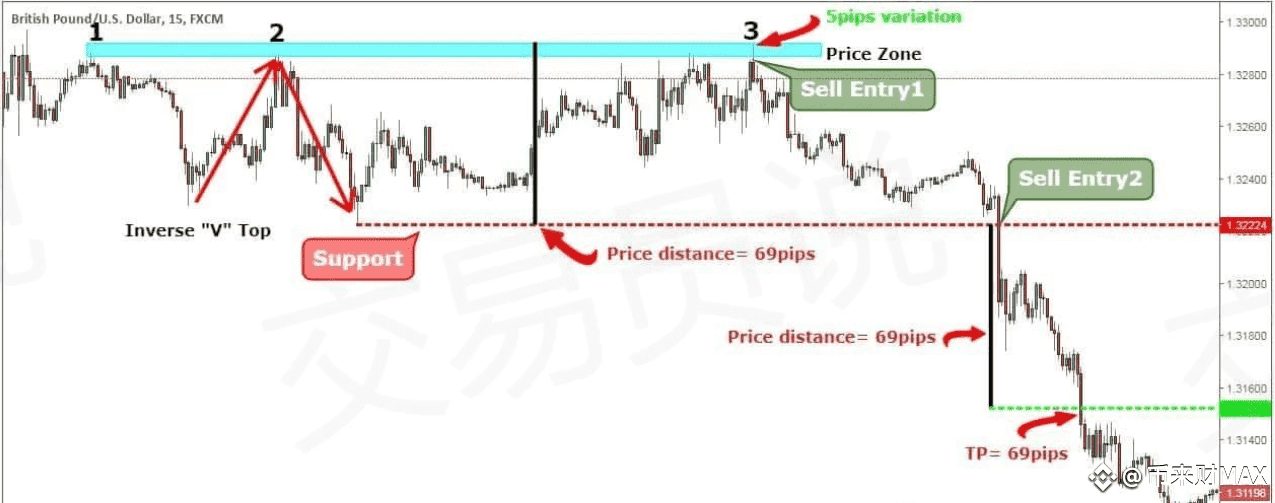
Step #4: Profit target equals the price distance from the highest point to the lowest point.
The minimum average drop after the triple top reversal breakout is roughly equal to the price distance from the highest point to the lowest point.
If we project the same price distance downward, we can obtain the first profit range of the triple top chart pattern trading strategy.
Next, another important matter we need to determine is the position of the protective stop-loss.
Step #5: Set the protective stop-loss slightly above the resistance level formed by the triple top pattern.
The triple top chart pattern trading strategy provides traders with a simple method to quantify risks, as you can set the protective stop-loss slightly above the resistance level of the triple top pattern.
The key to trading the triple top pattern is to express opinions based on wise judgments while controlling risks as much as possible. You also do not want to use overly wide stop losses.
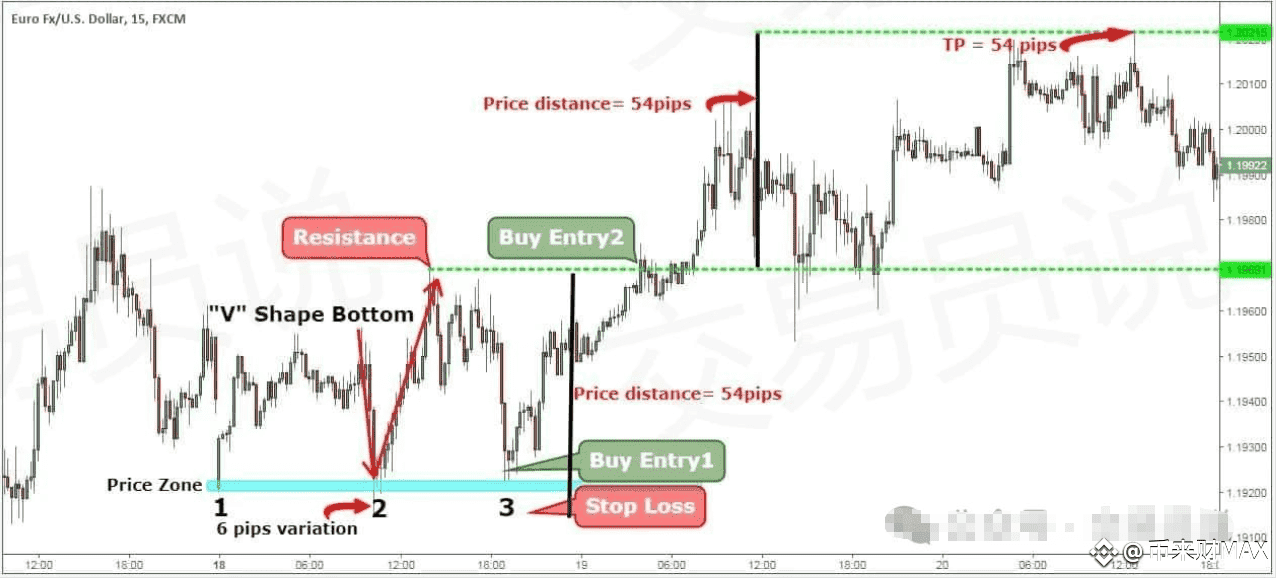
Note: The above is an example of a short trade. For long trades, you can use the same rules in reverse. This time, we will use the triple bottom pattern. The following image shows an actual example of a buying trade using the triple bottom pattern.
Using Dow Theory in a reverse trading strategy for triple tops.
The principle that 'trends will continue until a clear reversal signal appears' is an extremely important principle in Dow Theory. Mastering this concept allows you to see whether a trend will continue or reverse, and thus determine the correct trading strategy.
For example, if in an upward trend, the latest high and latest low have not shown an upward shift and are below the most recent low, it can be judged that the upward trend will reverse to a downward trend. Thinking in line with Dow Theory helps improve the accuracy of counter-trend trading.
As mentioned earlier, the three 'peaks' of the triple top do not necessarily have to be of equal height; there may be deviations. The focus here is on the positional relationship between the peaks according to Dow Theory. Once the high points start to decline, a trend reversal may occur; and if the low points also decline, the probability will significantly increase.
If the triple top appears near the market peak, it indicates the end of the upward trend. In interpreting the market, note that although the high was tested upwards 3 times, it was blocked by the same resistance level and ultimately resulted in a downward trend.
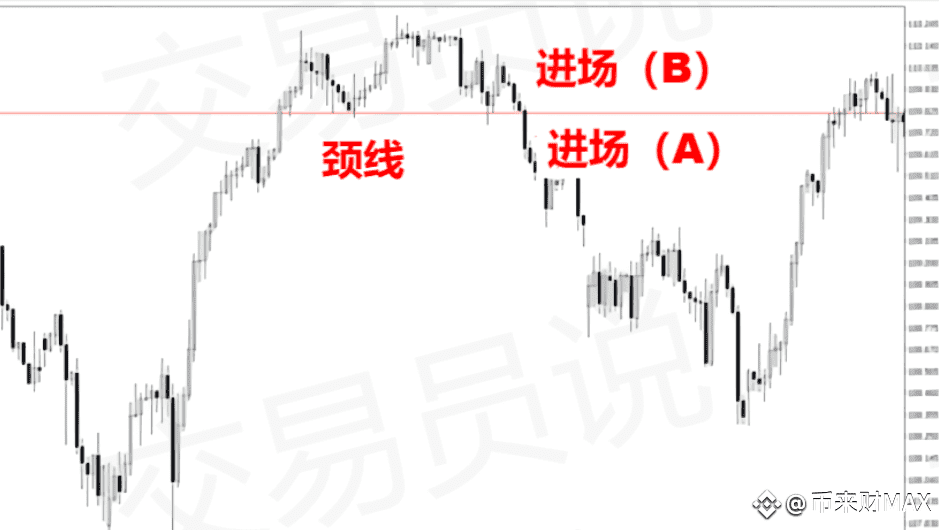
Similar to head and shoulders, if the price breaks the 'neckline,' the decline will become more severe. Therefore, you should enter when the price breaks below the neckline. Additionally, if you can accurately anticipate that the chart pattern will form a triple top, you can also choose to enter at the third high point.
Entry operation.
(A)Based on the premise of meeting the conditions of the Dow Theory's upward trend, enter a short position when the triple top formation is formed and the price breaks below the neckline.
(B)Based on the premise of meeting the conditions of the Dow Theory's upward trend, enter a short position when the triple top formation is formed and at the third high point.
Summary.
The triple top pattern does not appear as frequently as other chart patterns, but once it does, it can potentially provide you with substantial profits. Moreover, the triple top reversal is a very reliable price pattern, and we recommend trading it within the intraday timeframe as its appearance frequency is higher.
The significance of the triple top chart pattern trading strategy is that it provides you with the opportunity to enter at the beginning of a new trend.
Additionally, when using Dow Theory to trade triple tops or head and shoulders and other chart patterns, you need to be familiar with the characteristics of various patterns to improve your trading win rate.
If you also have tens of thousands of dollars in capital, but you don't want to resign yourself to that, and you want to try your luck in the cryptocurrency market but are afraid of pitfalls; I can share this method with you.
Including: How to survive in the early stages? How to allocate positions? How to find entry points? How to use compound interest to achieve doubling?
But I won't write it publicly.
Those who are willing to give it a try, please like + follow.
Not everyone can do it, but the moment you are willing to change is the first day of your turnaround.
The money in the cryptocurrency market is never 'gambled' but 'calculated.' Follow me to ensure that every dollar of your capital is on the right track.