
Bubblemaps is a cutting-edge blockchain data visualization tool designed to simplify the way users explore and understand on-chain activity. Previously known as Moonlight, it transforms complex transactional data into visually engaging, interactive bubble charts. This makes it an ideal resource not only for seasoned analysts but also for newcomers looking to delve into blockchain transparency.
With Bubblemaps, users can clearly see the flow of assets, the relationships between wallet addresses, and detect unusual or manipulative behavior—making it especially useful during speculative trends like meme coin seasons.
Key Features of Bubblemaps
🔹 Intuitive Bubble Maps
Bubblemaps uses bubble-based visualizations to depict the connections between wallets and token holders. Each bubble represents a wallet, with its size corresponding to the number of tokens held. Lines between bubbles signify transactional links. This intuitive approach replaces traditional blockchain explorers with a more visual, user-friendly experience.
🔹 Wallet Analysis Made Simple
By highlighting how tokens are distributed and identifying wallet clusters, Bubblemaps helps reveal whether a project is genuinely decentralized or heavily controlled by insiders. This functionality plays a critical role in mitigating investment risks by spotting signs of potential manipulation.
🔹 Real-Time Investigations via Intel Desk
Bubblemaps empowers its community through the Intel Desk, a collaborative space where users can contribute findings on suspicious activities. Participants may receive rewards for valuable insights, encouraging collective vigilance and deeper transparency within the ecosystem.
🔹 Multi-Chain Compatibility
#Bubblemaps supports several major blockchain networks, offering cross-chain analysis capabilities. This enables users to monitor wallet behaviors and token distributions across different ecosystems, improving portfolio management and enhancing insight into broader blockchain trends.
Advanced Functionalities
🔸 Magic Nodes
This feature automatically uncovers indirect or hidden wallet connections that may not be immediately visible. It enhances the standard map by inserting intermediary addresses that bridge key holders, allowing users to detect subtle relationships and possible manipulations.
🔸 Time Travel
With Time Travel, users can analyze how token distributions have evolved over time. By selecting specific dates, one can observe the history of transactions, giving a fuller picture of how a token’s supply has changed and who has controlled it.
Practical Applications
✅ Fraud Detection
Bubblemaps is instrumental in identifying red flags like insider trading or coordinated market manipulation. For example, it has exposed highly concentrated token distributions in suspicious projects, enabling investors to make better-informed decisions.
✅ Community-Driven Transparency
By leveraging collective intelligence, Bubblemaps creates a decentralized layer of oversight. This not only increases trust but also helps ensure that projects stay accountable to their decentralization promises.
Why Bubble Maps Work So Well
Bubblemaps belongs to a broader family of mind mapping tools—visual frameworks designed to explore relationships between concepts. However, bubble maps are uniquely effective at presenting descriptive and comparative data in a compact, visual form.
Unlike linear data charts, bubble maps allow ideas to be explored in a more freeform, intuitive way. The larger or more connected a bubble is, the more significant it becomes in context—making it ideal for surfacing patterns or anomalies in blockchain data.
How Bubble Maps Differ from Other Visual Tools
Cluster Maps: Often used in geographic data analysis, they use spatial bubbles to represent population or impact size across regions—not wallet behavior.
Bubble Plots: These show numerical data using circles but lack the relational aspect between entities that Bubblemaps offers.
Double Bubble Maps: Useful for comparing two related concepts, similar to a Venn diagram, but Bubblemaps go further by tracking dynamic, real-time wallet relationships.
Use Cases for Bubble Mapping Beyond Crypto
Even outside of blockchain, bubble maps are useful for:
Conceptual thinking: Breaking down abstract ideas into clear, visual connections.
Brainstorming: Generating and organizing ideas with minimal constraints.
Project planning: Mapping out tasks, goals, and roles in an easily digestible format.
Essay writing: Exploring potential arguments or structures around a central topic.
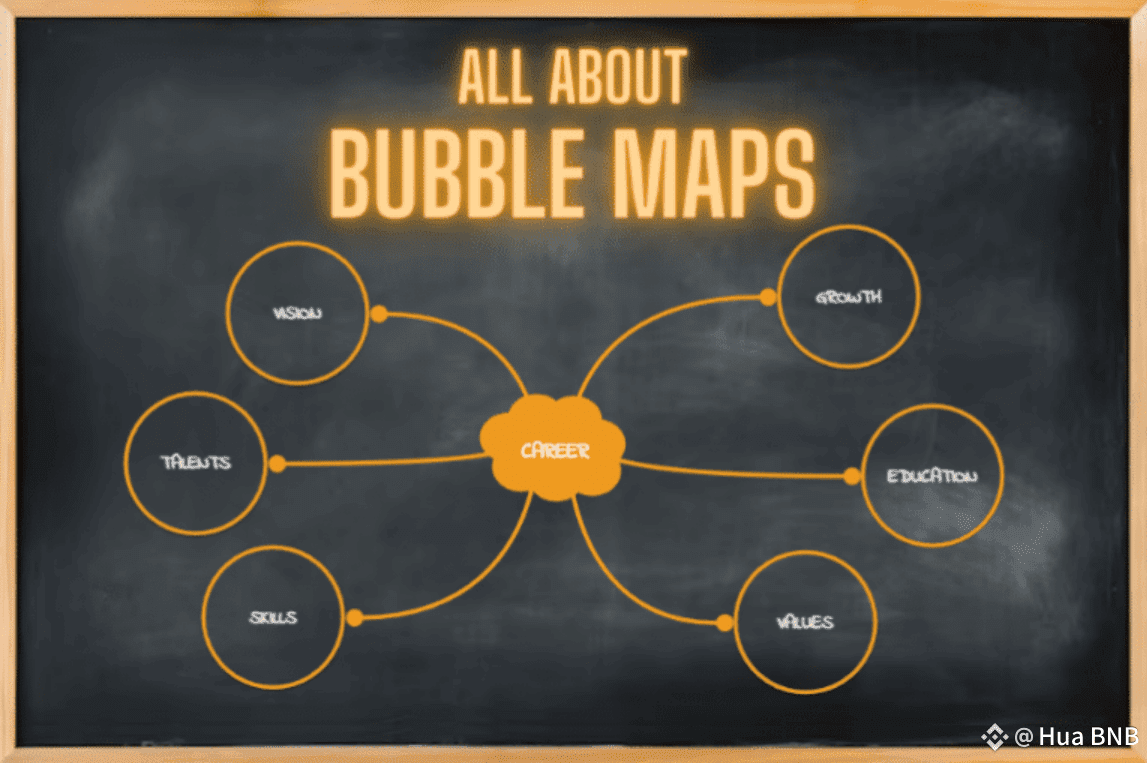
How to Create a Bubble Map
Step 1: Define the Central Idea
Start by placing your main concept in the center of the map. This should be a core noun or topic—for example, “Token Distribution.”
Step 2: Add Direct Connections
Around the central bubble, create smaller bubbles representing directly related ideas or components, such as “Top Holders,” “Wallet Activity,” or “Transaction Volume.”
Step 3: Expand with Sub-Connections
Branch off these bubbles with more specific insights or details. For example, “Insider Clustering,” “Exchange Wallets,” or “Inactive Addresses.”
Step 4: Emphasize Relevance
Use size, color, or shape to show importance, risk level, or relationship type. Dotted lines can indicate weaker or indirect links.
Conclusion
Bubblemaps offers a fresh, accessible approach to understanding blockchain data. By visualizing relationships between wallets and tracking token flow over time, it helps users spot risks, discover patterns, and stay informed in an increasingly complex crypto space. Whether you’re an investor, analyst, or community contributor, Bubblemaps is a powerful tool to enhance your on-chain decision-making and deepen your insights into decentralization.
#Bubblemaps @Bubblemaps.io $BMT