Ripple is trending down after a strong price increase that began in June. As both the USDT and BTC pairs are currently showing signs of bearishness, investors are cautiously considering whether the existing support levels can hold and prevent a complete reversal.
Technical Analysis
USDT Pair
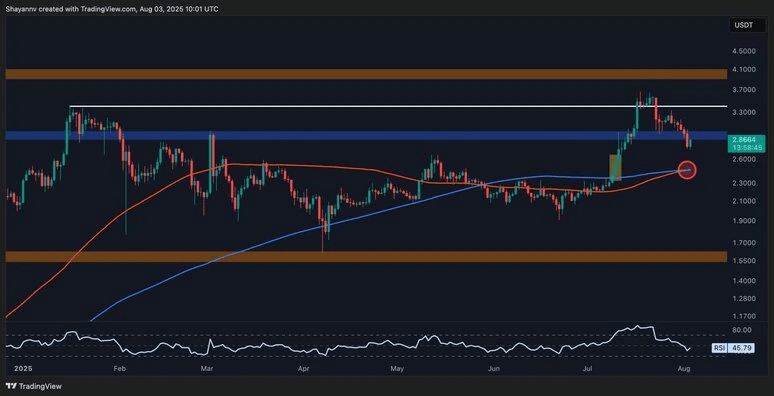
On the XRP/USDT pair, Ripple's token has been rising since the beginning of July, before surpassing the high of $3.40 and reversing down. The market is now returning to the 100-day and 200-day moving averages, located near the $2.50 mark, and has just created a bullish crossover.
Currently, the $3.00 level has been lost, and without a quick recovery back above this level, the mentioned moving averages will be the next targets. Although the convergence of these moving averages creates a potential strong support level, if it is broken downwards, a further decline towards the $1.60 area may occur.
XRP/BTC Pair
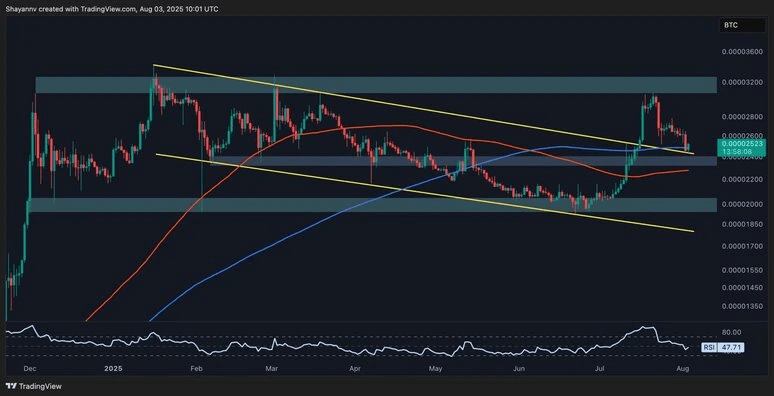
The XRP/BTC pair is also undergoing a similar correction after being quickly rejected from the resistance zone of 3,200 SAT. The price is currently testing the 200-day moving average and the upper boundary of the descending channel that was broken around the 2,500 SAT mark.
The RSI indicator has also dropped from deep overbought levels down just below 50, indicating a significant change in momentum. If the support area of 2,500 SAT is broken downwards, the price will return to the price channel and is likely to head towards the 2,000 SAT region. This scenario could lead to a prolonged accumulation and reset the current bullish trend.