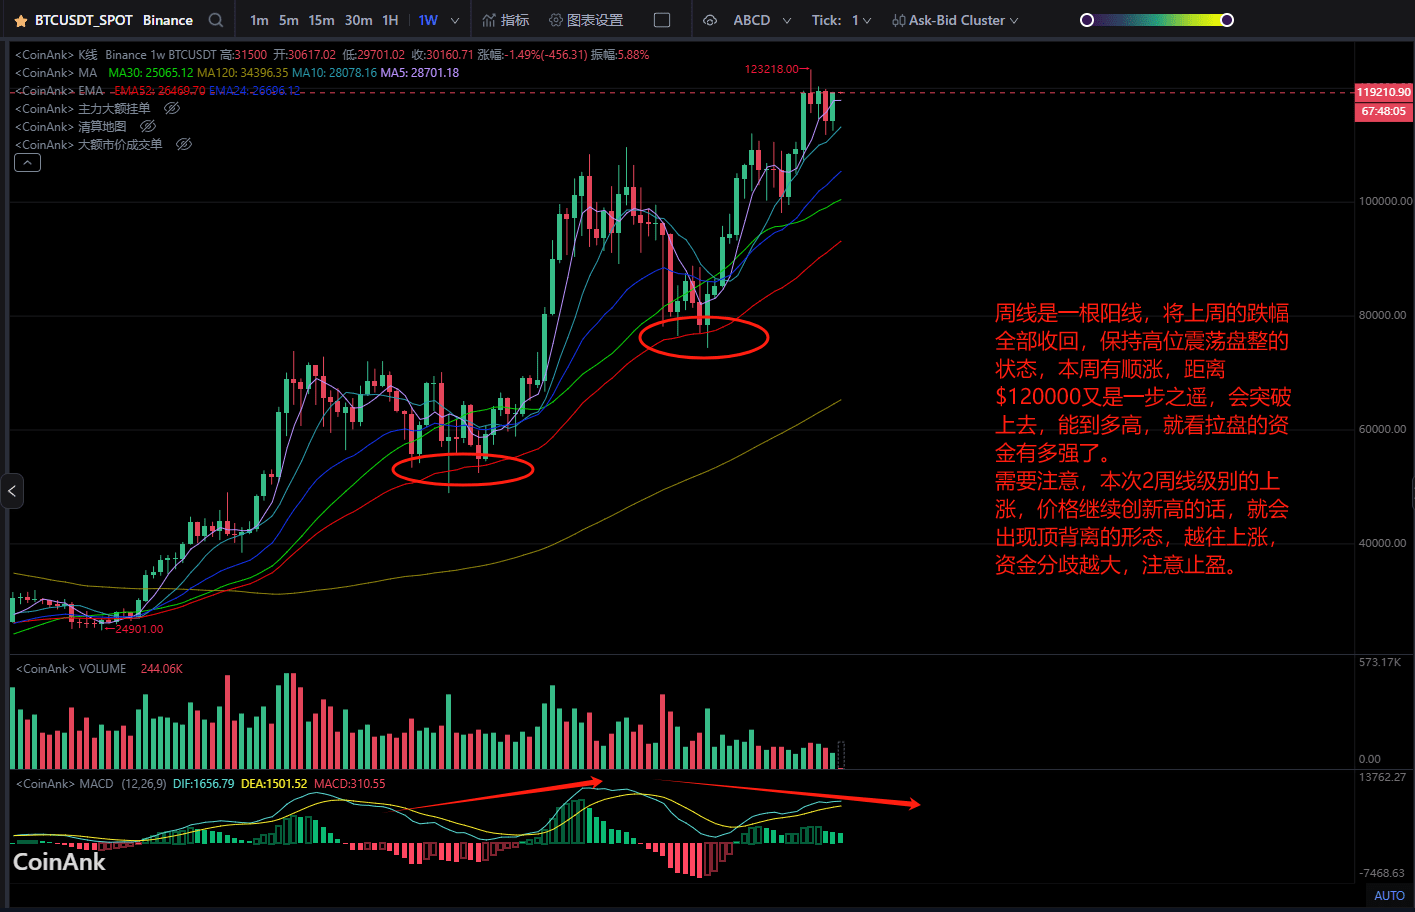
The weekly line is a bullish candle, completely recovering last week's decline, maintaining a high-level consolidation state. This week shows an uptrend, just one step away from $120,000, and it will break through. How high it goes depends on the strength of the capital driving the market.
It is important to note that if the price continues to reach new highs during this 2-week level uptrend, a top divergence pattern will appear. The higher it goes, the greater the divergence in capital, so be cautious about taking profits.
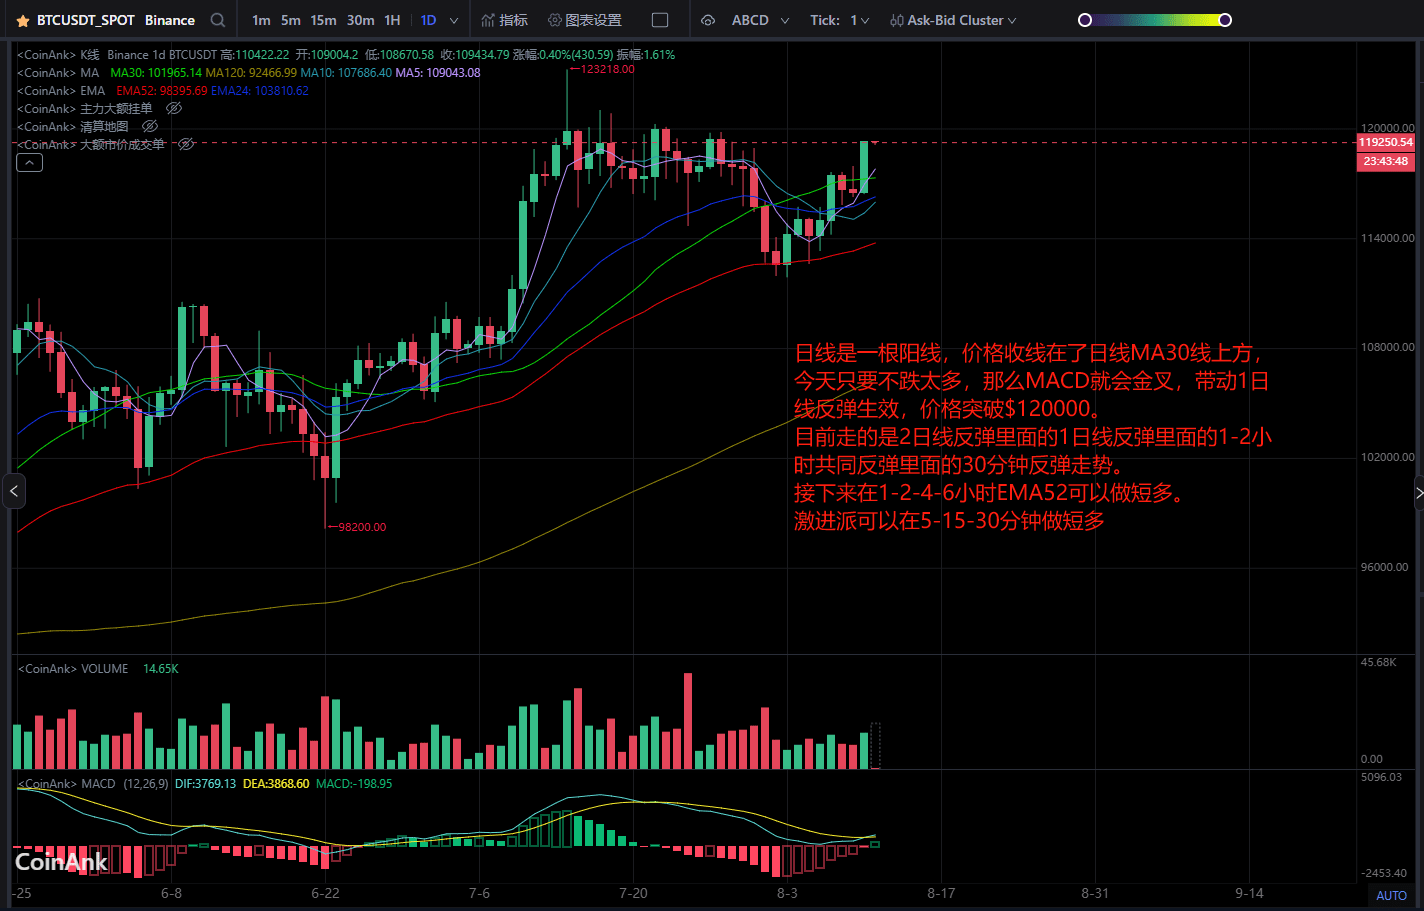
The daily line is a bullish candle, with the price closing above the daily MA30. As long as it doesn't drop too much today, the MACD will golden cross, driving the 1-day line rebound into effect, with the price breaking through $120,000.
Currently, it is a rebound within the 1-day line of the 2-day line, within a 1-2 hour common rebound, within a 30-minute rebound trend.
Next, a short-term long position can be taken at the 1-2-4-6 hour EMA52.
Aggressive traders can take short-term long positions in the 5-15-30 minute time frames.