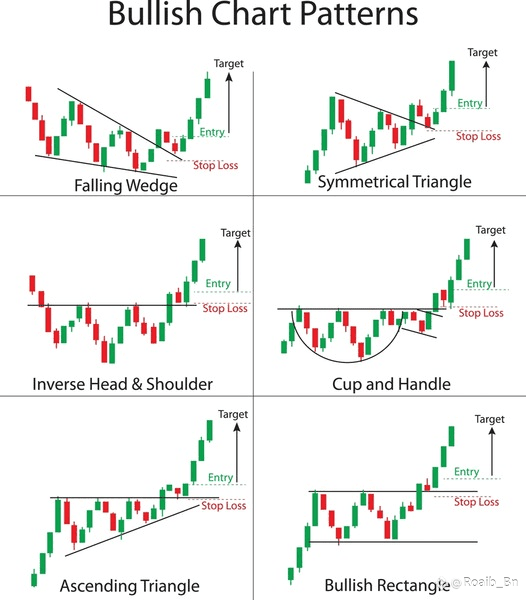
✅ Bullish Chart Patterns (1 to 6)
1️⃣ Falling Wedge
Price moves down within a narrowing range
Breakout to the upside expected
📈 Entry: After breakout
🛑 Stop Loss: Below the wedge
🎯 Target: Height of the wedge added to breakout
---
2️⃣ Symmetrical Triangle
Price consolidates with lower highs and higher lows
Breakout direction matters — this is bullish
📈 Entry: On upward breakout
🛑 Stop Loss: Below triangle
🎯 Target: Height of the triangle
---
3️⃣ Inverse Head & Shoulders
Three dips, middle (head) is the lowest
Breakout above neckline confirms reversal
📈 Entry: On neckline breakout
🛑 Stop Loss: Below right shoulder
🎯 Target: Distance from head to neckline
---
4️⃣ Cup and Handle ☕
U-shaped recovery followed by a slight pullback (handle)
Breakout signals strong upward momentum
📈 Entry: Break above handle
🛑 Stop Loss: Below handle
🎯 Target: Height of the cup
---
5️⃣ Ascending Triangle 🔺
Flat top resistance with rising support
Breakout suggests bullish continuation
📈 Entry: Break above resistance
🛑 Stop Loss: Below ascending trendline
🎯 Target: Height of triangle
---
6️⃣ Bullish Rectangle ⬛
Price moves between horizontal support & resistance
Breakout confirms bullish trend continuation
📈 Entry: Breakout above rectangle
🛑 Stop Loss: Below support
🎯 Target: Height of rectangle
HERE is the candles image 👇
IF you find the post helpful then please follow like and comment on it thanks 👍
#ProjectCrypto #TrumpTariffs #MarketPullback #WhiteHouseDigitalAssetReport #FOMCMeeting