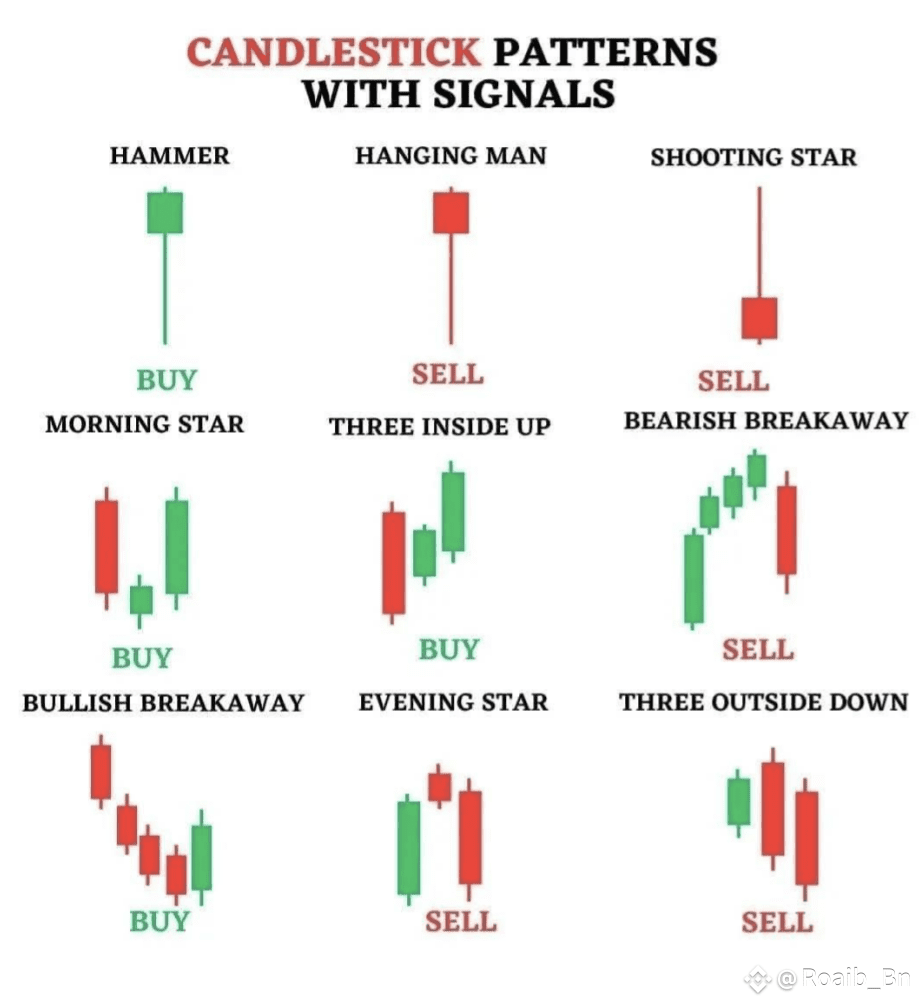
🔹 Row 1:
Hammer (BUY)
🔨 A bullish reversal pattern seen at the bottom of a downtrend.
Hanging Man (SELL)
⚠️ Appears at the top, signaling potential bearish reversal.
Shooting Star (SELL)
🌠 A bearish signal after an uptrend, indicating price rejection at higher levels.
---
🔹 Row 2:
Morning Star (BUY)
🌅 A 3-candle pattern signaling the end of a downtrend and a bullish reversal.
Three Inside Up (BUY)
📈 A bullish reversal where two green candles follow a red one, confirming strength.
Bearish Breakaway (SELL)
📉 A bearish reversal pattern after a steady rise, showing selling pressure.
---
🔹 Row 3:
Bullish Breakaway (BUY)
💚 A trend reversal pattern after a fall, showing buyers stepping in.
Evening Star (SELL)
🌇 A 3-candle pattern indicating a shift from bullish to bearish trend.
Three Outside Down (SELL)
🔻 A strong bearish reversal confirmed by two red candles engulfing a green one.
HERE is the candles image 👇
IF you find the post helpful then please follow like and comment on it thanks 👍
#BuiltonSolayer #IPOWave #BTCUnbound #CFTCCryptoSprint #BinanceHODLerPROVE