$XRP is facing a key moment. Over the last 24 hours, it has dropped 2.2% and is trading between $2.85 and $2.88. The market cap sits at $170.83 billion, with $7.48 billion traded in just one day. The big question now is: has XRP found a bottom, or is this just another trap before another dip?
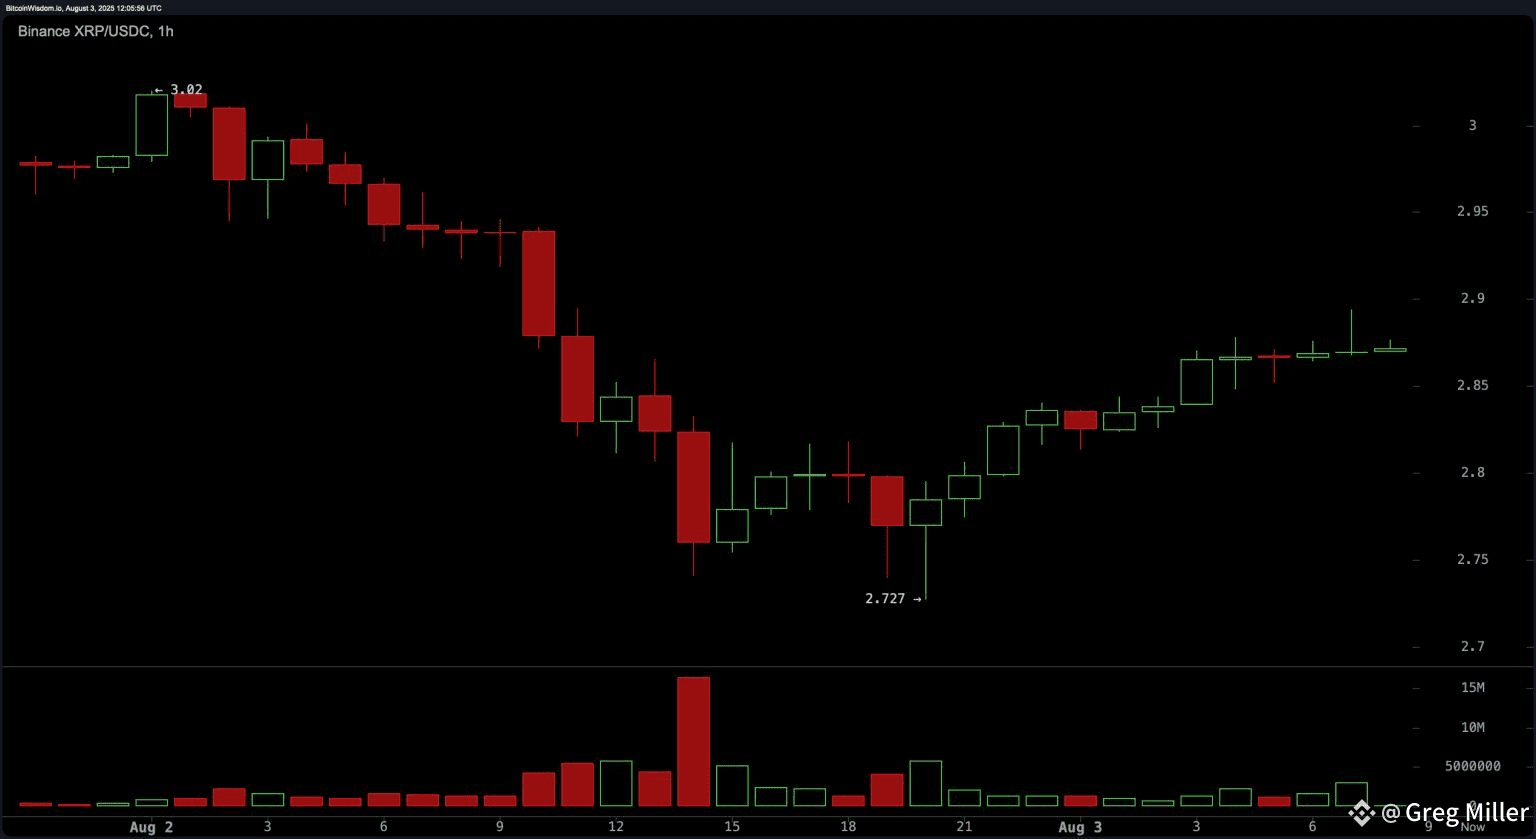
1-Hour Chart: Rounded Bottom Formation?
On the 1-hour chart, XRP shows signs of forming a rounded bottom pattern. After hitting a low at $2.727, the price started to recover slowly. We’ve seen green candles with increasing volume, meaning more buyers are stepping in. Short-term resistance is between $2.88 and $2.90, while support is around $2.80.
Traders who like quick trades (scalping) may look to buy if the price dips near $2.82–$2.85, aiming for targets between $2.95 and $3.00, if they place a stop-loss just below $2.80.
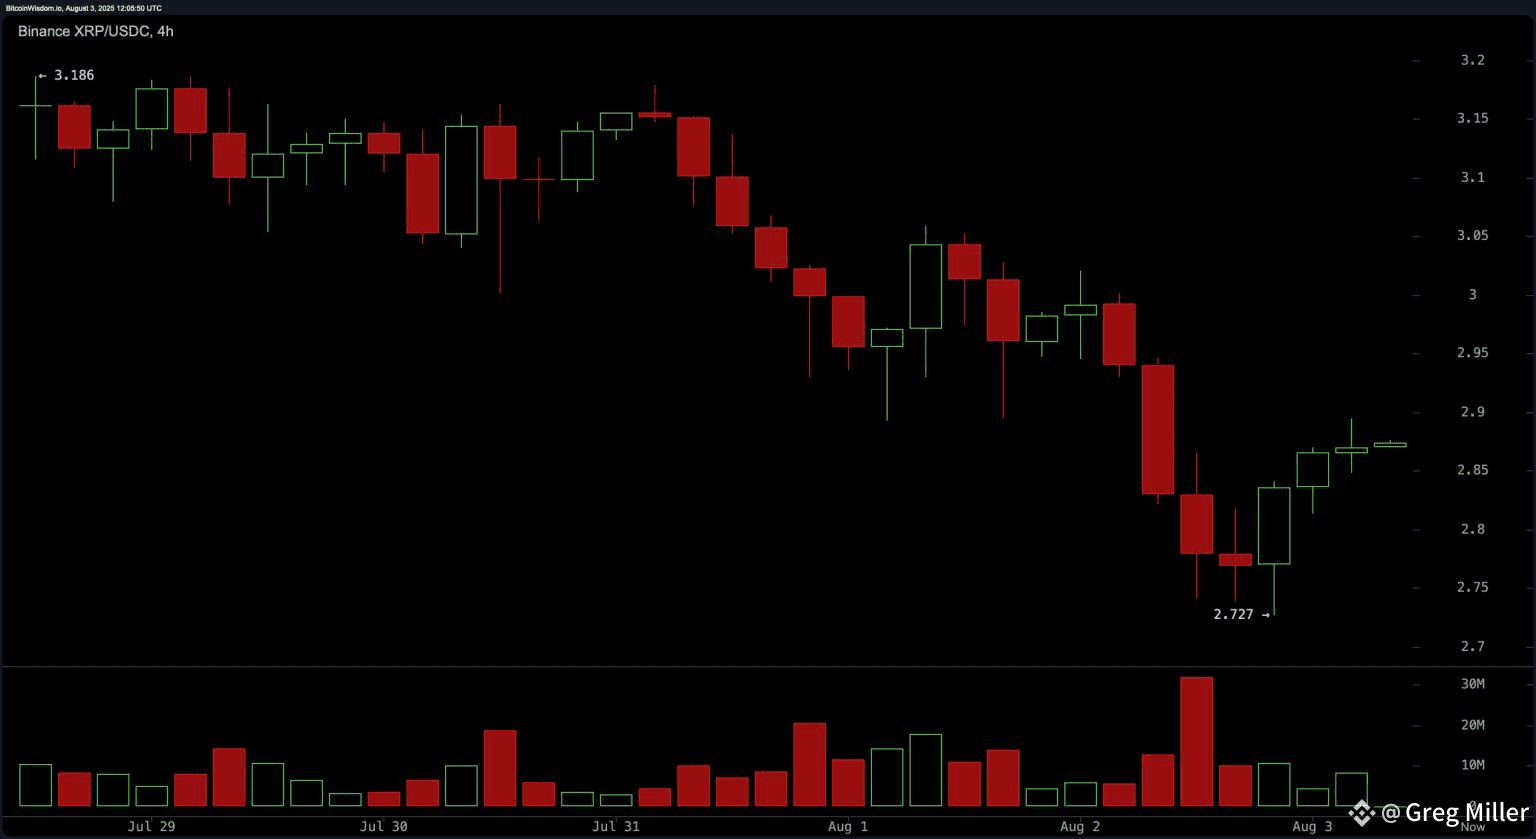
4-Hour Chart: Bullish Hints
The 4-hour chart tells a slightly different story. XRP had been making lower highs and lower lows, a sign of a downtrend. But recently, a double bottom near $2.727 formed, and the price broke out toward $2.85. The breakout came with a big spike in volume, which could mean that big players are buying in again.
If XRP stays above $2.85 with solid volume, we might see a proper trend reversal. However, $3.00 still stands as a big challenge.
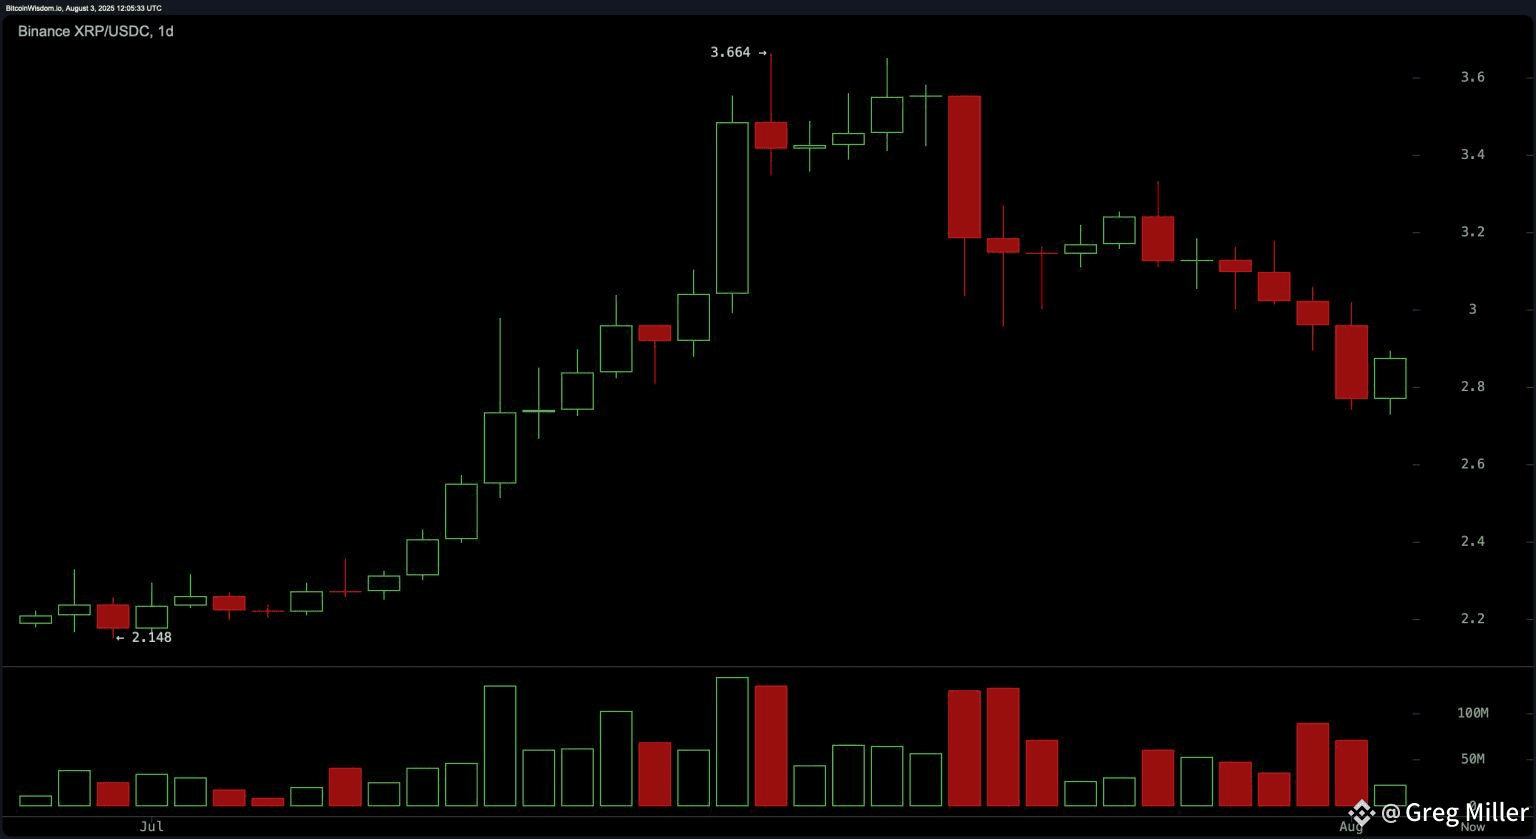
Daily Chart: Holding $2.70 Is Key
Looking at the bigger picture, XRP hit $3.664 in July before falling. The drop formed a support level around $2.70, and recent price action suggests buyers are defending this zone. A daily candle closed with a bullish pattern, hinting that a bounce may be in play.
A confirmed daily close above $2.90 would be strong evidence that XRP is ready to move higher, potentially testing the $3.00 to $3.30 resistance area again.
Indicators: Mixed Signals
The technical indicators are giving mixed messages:
RSI (46.07) – Neutral
Stochastic (9.31) – Neutral
CCI (−130.59) – Bullish
Momentum (−0.27) – Bullish
MACD (0.062) – Bearish
ADX (36.32) – Weak but directional
Awesome Oscillator (0.095) – Neutral
So, while some indicators show early signs of strength, others still flash warning signals.
Moving Averages: Short-Term Bearish, Long-Term Bullish
In the short term, moving averages like the 10-period and 20-period EMA/SMA are above the current price, usually a bearish sign. But the longer-term moving averages (50, 100, and 200) are still pointing up, which means XRP’s long-term structure remains bullish.
This contrast shows the market may be in a consolidation phase, sideways movement before a possible breakout.
Final Verdict
🔹 Bullish Case:
If XRP holds above $2.85 and closes above $2.90 with strong volume, we could see a move back toward $3.00–$3.30. Long-term indicators support this view.
🔹 Bearish Case:
If XRP fails to reclaim $2.90 and $3.00, it may drop back to $2.70 or lower. The short-term charts still show weakness, and bears aren’t gone yet.
Bottom Line:
XRP is at a key decision point. If bulls can push past resistance with volume, the uptrend might restart. But until then, traders should be cautious, this could still be a bull trap.
