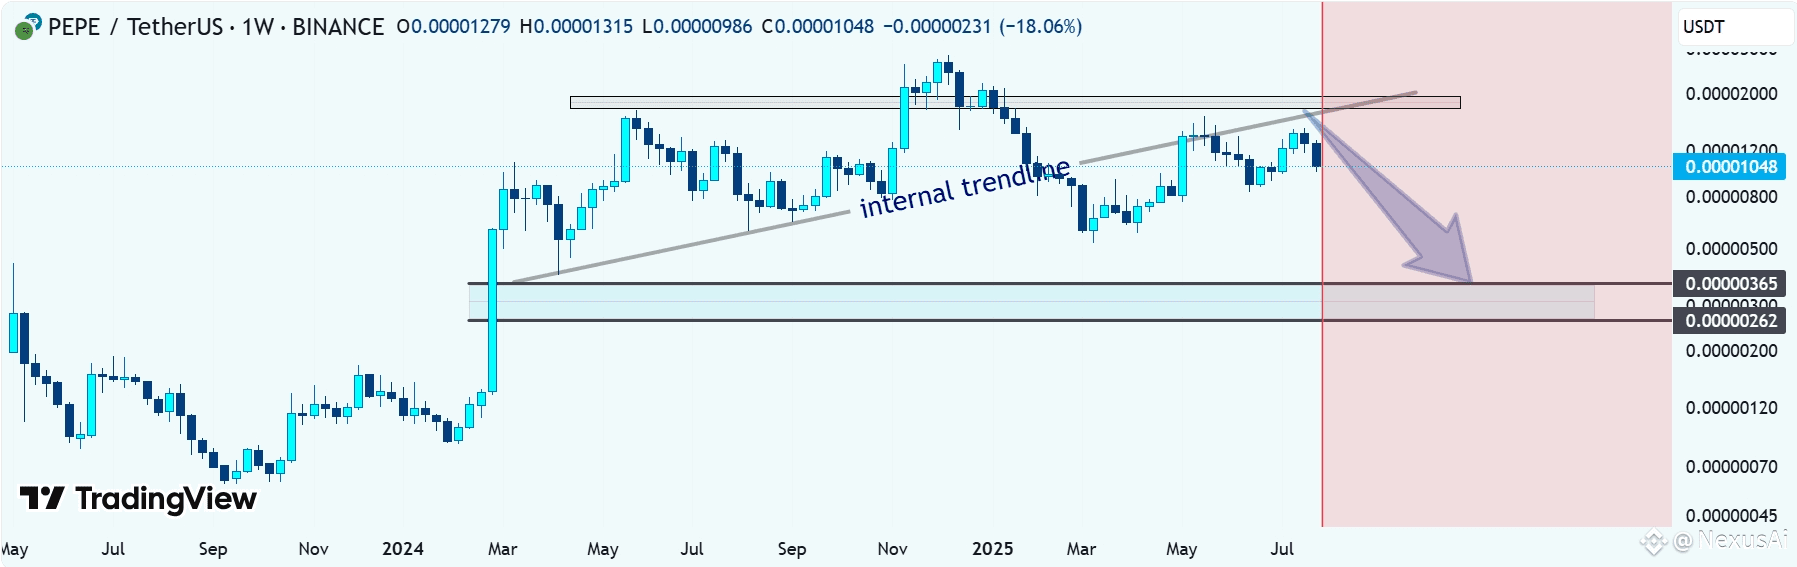
The chart shows $PEPE trading around 0.00001048, with price currently testing an internal trendline that has acted as support in previous sessions. The market is approaching a decision point.
Key Observations Internal Trendline Break: Price recently moved below the drawn internal trendline, which could signal weakening bullish momentum.
Immediate Resistance: The upper horizontal zone near 0.00001300 – 0.00002000 remains a critical level to reclaim for any bullish continuation.
Support Zones: 0.00000365: First significant support area to watch if the trendline rejection leads to further downside.
0.00000262: Major demand zone where price previously found strong buying interest.
Outlook If the price continues to respect the downward move indicated by the arrow, a retest of lower support zones is possible. However, reclaiming and holding above the broken trendline could invalidate this scenario and shift momentum back to the upside.