Most crypto losses?
They happen when you don’t understand the charts.
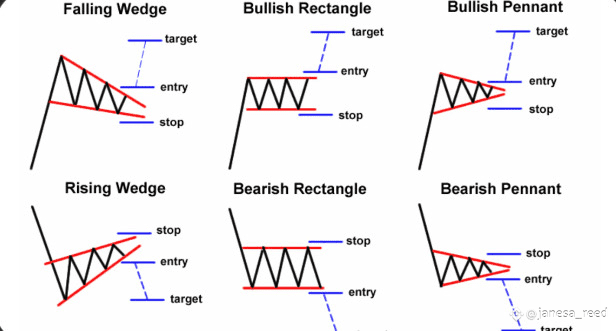
Here’s your visual cheat sheet to the 6 most powerful bullish & bearish patterns in crypto 👇
🔼
Bullish Patterns — Spot the Breakout!
1️⃣ Falling Wedge 🔻➡️📈
Price tightens → boom, breakout!
📥 Entry: Break above wedge
🛑 Stop: Just below support
🎯 Target: Height of wedge
2️⃣ Bullish Rectangle ⬛📈
Sideways grind = setup for launch.
📥 Entry: Break above resistance
🛑 Stop: Below support
🎯 Target: Height of rectangle
3️⃣ Bullish Pennant 🚩📈
Mini flag after a pump — next leg incoming!
📥 Entry: Breakout from pennant
🛑 Stop: Slightly under pattern
🎯 Target: Length of flagpole
🔽
Bearish Patterns — Ride the Dump!
4️⃣ Rising Wedge 🔺➡️📉
Price rising… but support weakening.
📥 Entry: Breakdown below wedge
🛑 Stop: Above resistance
🎯 Target: Height of wedge
5️⃣ Bearish Rectangle ⬛📉
Support is about to snap.
📥 Entry: Break below support
🛑 Stop: Above resistance
🎯 Target: Rectangle height
6️⃣ Bearish Pennant 🚩📉
Quick drop → small pause → more downside ahead.
📥 Entry: Breakdown below pennant
🛑 Stop: Just above pattern
🎯 Target: Pole length again downward
📊 Visual guide below 👇
💡 Save this post — refer before your next trade.
💬 Found it helpful?
❤️ Like | 💬 Comment | 🔔 Follow @janesa_reed for more price action alpha!
#CryptoTrading #TrumpTariffs #MarketPullback #WhiteHouseDigitalAssetReport #FOMCMeeting