

🌐 C/USDT — Rearrangement before the shot? Analysis of the new infrastructure token 📈
🧱 Fundamental analysis:
📌 What asset is this?
C/USDT — a fresh infrastructure token recently listed on Binance. Such projects are usually key components of Web3:
— decentralized storage,
— computational power,
— L1/L2 blockchain infrastructure,
— DePIN and ZK services.
🔍 Why is it attracting attention?
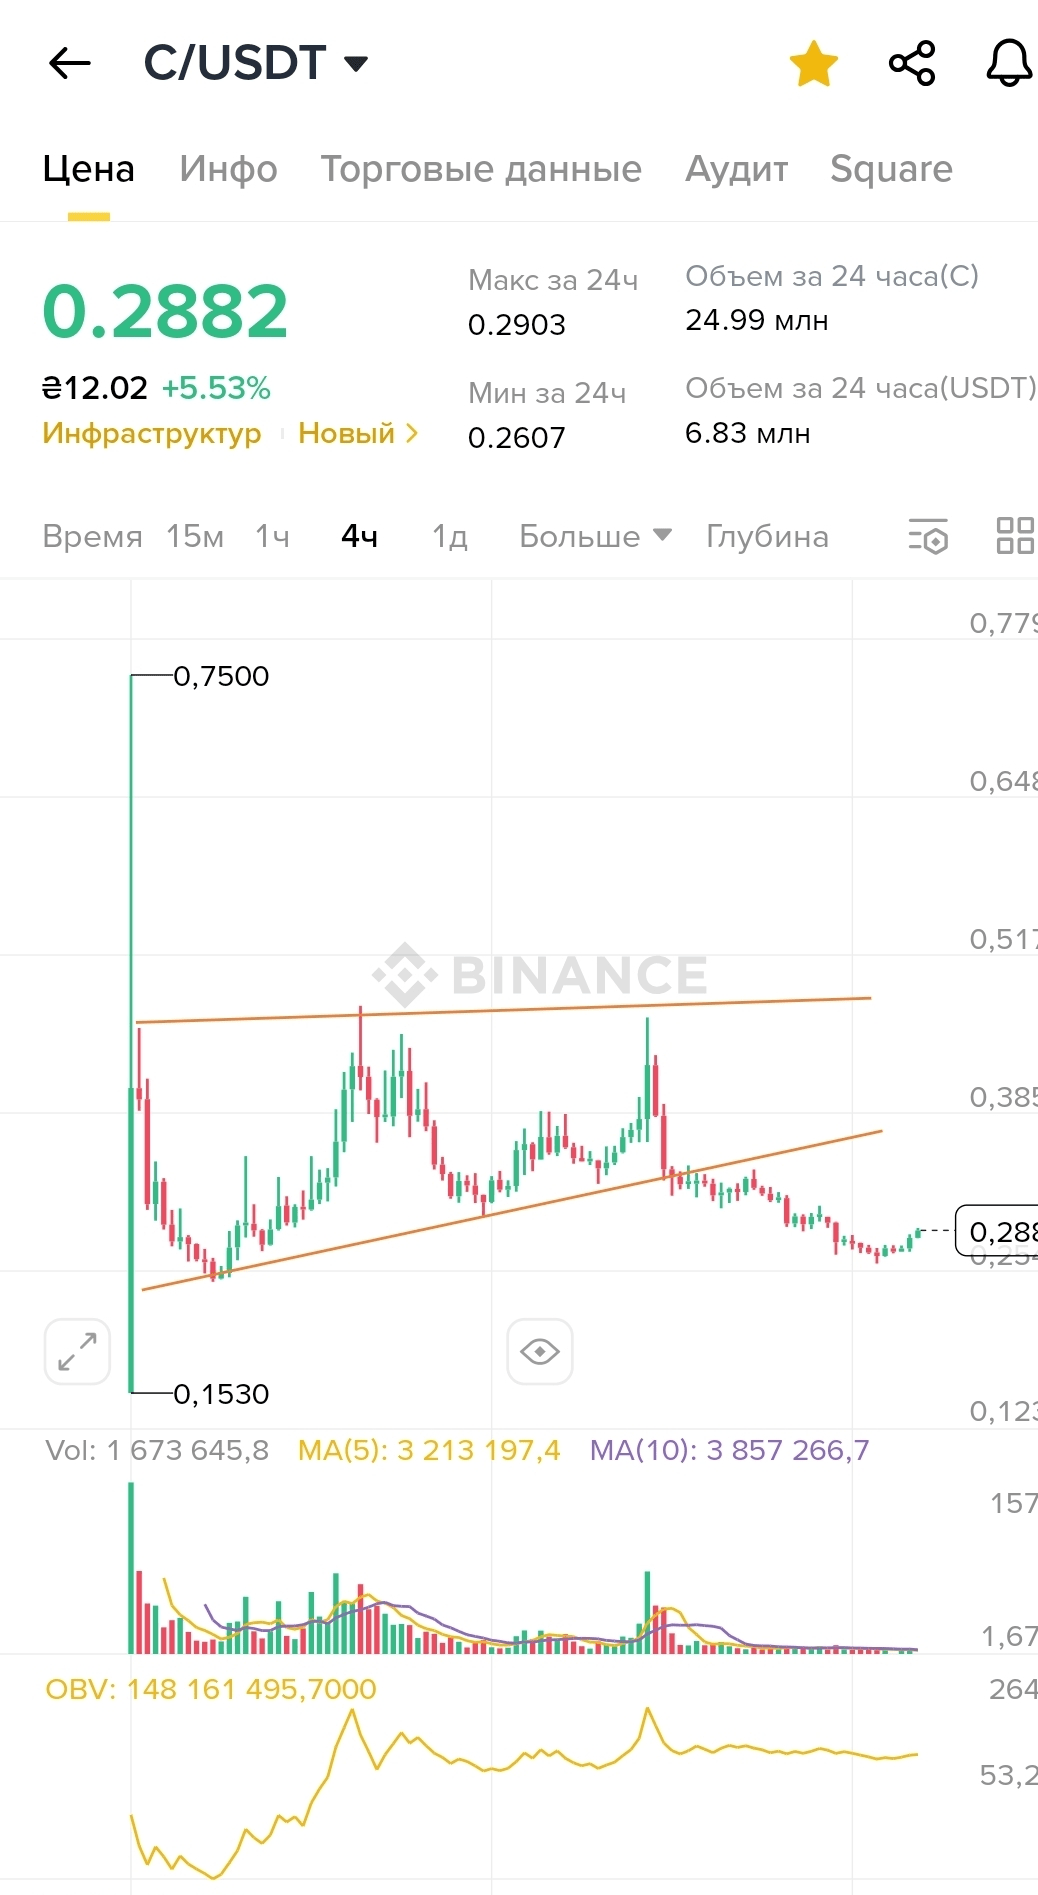
📊 24h volume: ~$25 million for C and ~$6.8 million for USDT — the asset is of interest to large players.
💡 The infrastructure segment is one of the most invested sectors in a bear market. Projects that solve real Web3 problems often show growth in the recovery cycle.
📈 OBV (On-Balance Volume) shows growth in the consolidation phase — a sign of hidden demand and accumulation.
📉 Technical analysis (TF: 4 hours):
The chart clearly shows an ascending wedge — this is potentially a bearish figure, especially if it appears after a rapid impulse growth.
🔍 Figure details:
Upper boundary: ~$0.38–0.39
Lower support (already broken): ~$0.26
Current price: $0.2882 — possible retest of the broken wedge boundary
Volumes are decreasing — a typical picture before a trend change
❗️ The figure has broken down, but without a critical sell-off — it could be either a false breakout or the beginning of a cooling phase. The market decides — to 'breathe' or to surge up again.
📌 Development options:
🟢 Bullish scenario:
Price consolidates above $0.29–0.30
Increase in volumes
Potential return to the zone $0.38–0.42
🔴 Bearish scenario:
Drop below $0.26
Possible decline to the range $0.22–0.20
In full cooling — a sideways movement or accumulation at lower levels!

