Using the 3-hour timeframe, we can see that a bullish divergence has formed on the XRP chart. While the price recently made lower lows, the Relative Strength Index (RSI) has been printing higher lows, indicating weakening bearish momentum. This divergence suggests that selling pressure may be fading and that a potential reversal could be on the horizon.
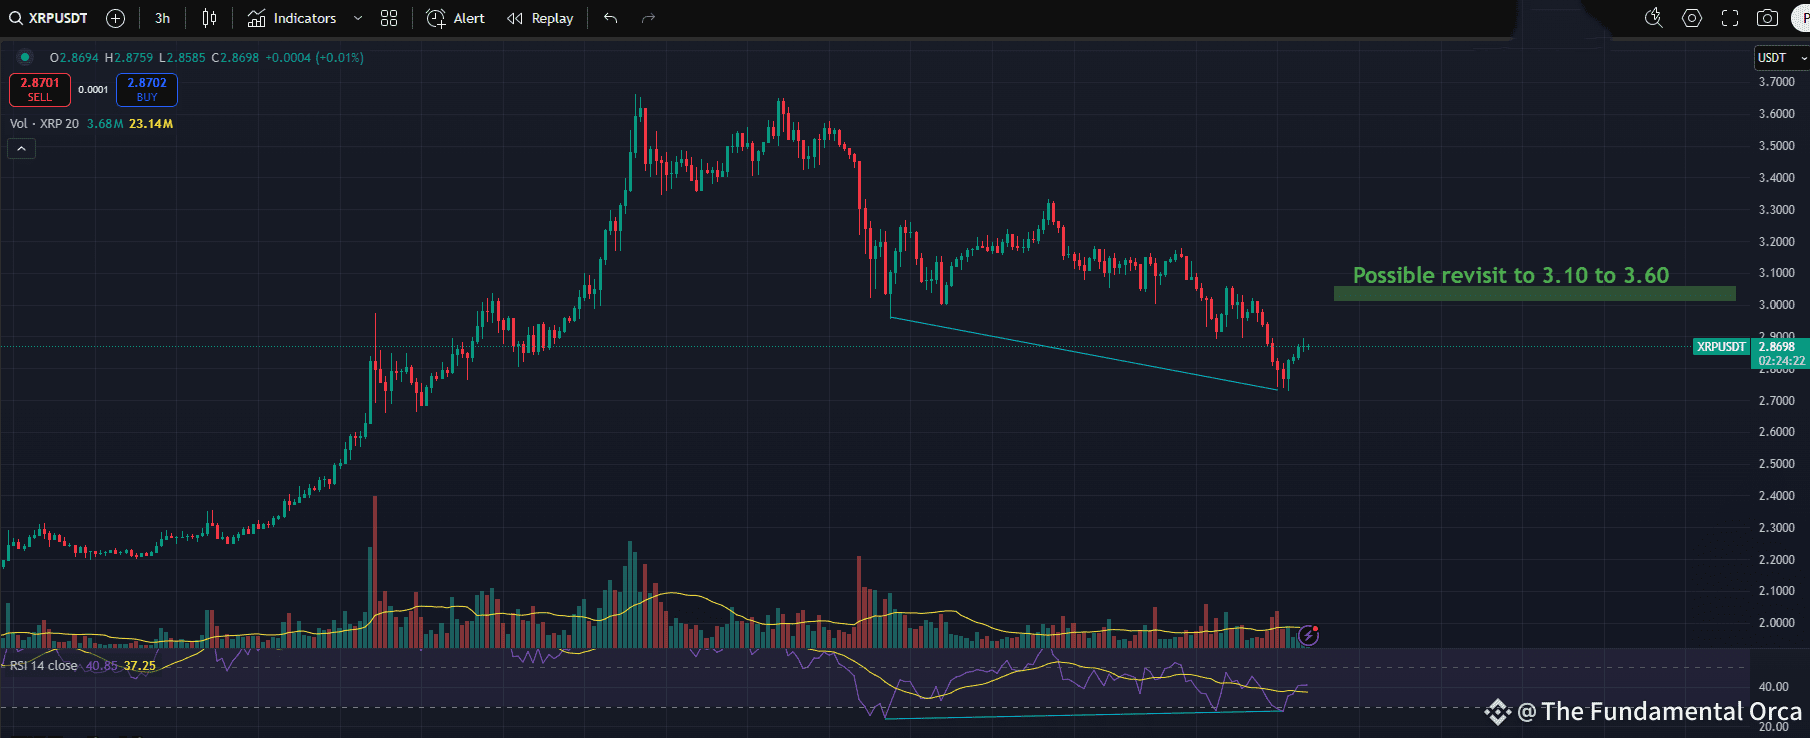
If buying volume increases and key resistance levels are broken, we could
see a short-term rally toward the $3.10–$3.60 range. Traders should monitor
this setup closely, as confirmation of the divergence could offer a favorable
risk-reward entry point.
Current trading: XRP is hovering around $2.86, down roughly 6%
in recent days. Recent intraday lows reached $2.75 during intense
selling pressure.Support zone: Analysts identify $2.40–$2.60 as a critical accumulation
range, supported by on-chain signals and recent whale activity. If XRP
holds there, a rebound could emerge.Resistance levels: Strong resistance lies between $3.10–$3.12 (near the 50‑day MA). A sustained break above could lead to extended upside.
Market dynamics: Spot volumes have cooled, hinting at seller exhaustion
and fading bearish momentum.
$XRP #xrpnews #ripple #xrpprice #analysis #XRPtrend