Among the historic tokens in the crypto market that initially misled in July for a possible recovery, Cosmos (ATOM) certainly stands out. It is currently priced at 4.15 USDT and in the first days of August shows a retracement of 1.30%.
Cosmos a missed recovery
However, July saw a higher low of 4.007 USDT compared to the previous months of June and the annual low of 3.386 USDT in March.
ATOM among the negative cryptos of 2025
Despite some signs of recovery, ATOM still registers a -32.86% since the beginning of 2025. A negative figure, but in line with the performance of other tokens in the Top 20, such as Polkadot, Avalanche, and the same Dogecoin, which show declines between -42% and -50% since January. At the current value, Cosmos has a market cap of 1.62 billion dollars and occupies the number 55 position.
July for Cosmos was interesting thanks to the IBC v4 update, which improved cross-chain interoperability and led to $1.2 billion in monthly transactions. The 'Eureka' update strengthened connections with Ethereum. These updates made on July 2 and 17 improved scalability and allowed the network to reach over 100 active chains.
Cosmos performance on the weekly from 2024
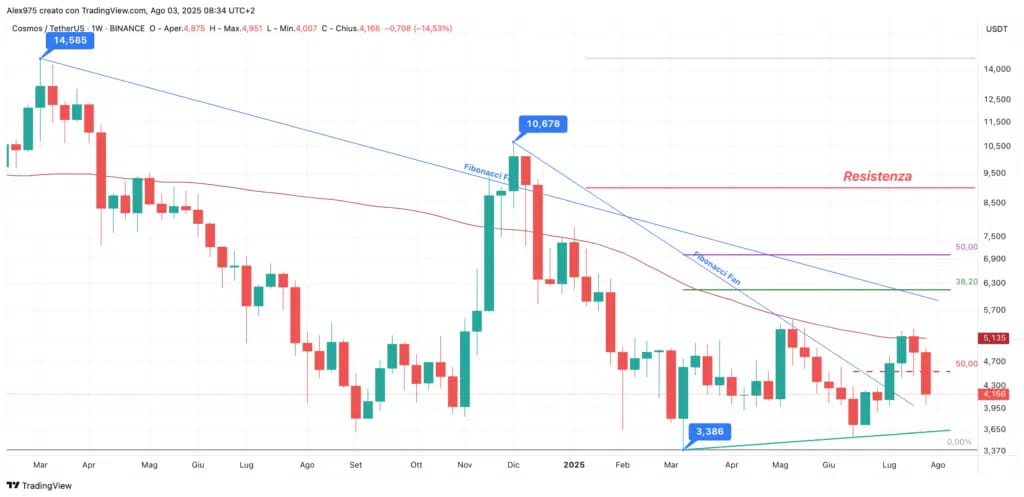
ATOM is one of the historic tokens in the cryptocurrency landscape, having been listed on exchanges since 2019. Its ATH was reached at 44.45 USDT in January 2022, from where a long and intense bearish phase began.
Looking at the weekly chart, it is noticeable that the last significant high was recorded in March 2024 at 14.56 USDT. From that level, a descending phase began, with a low reached in September at 3.61 USDT. Subsequently, the price marked a rebound that led to a high of 10.67 USDT in December, a value still lower than the peak in March.
2025 recovery attempt
In 2025, the decline continued. In March, Cosmos touched the annual low at 3.38 USDT. From this level, a rebound attempt began, reaching a high in May at 5.49 USDT, but without surpassing the first technical resistance, situated at 6.14 USDT.
Short-term scenario for ATOM
Turning to analyze the short-term situation of Cosmos on the daily chart, we have an overview starting from the June low at $3.55 USDT. From here, a rebound phase began that broke the resistance at $4.52 and reached a July high of $5.31 USDT.
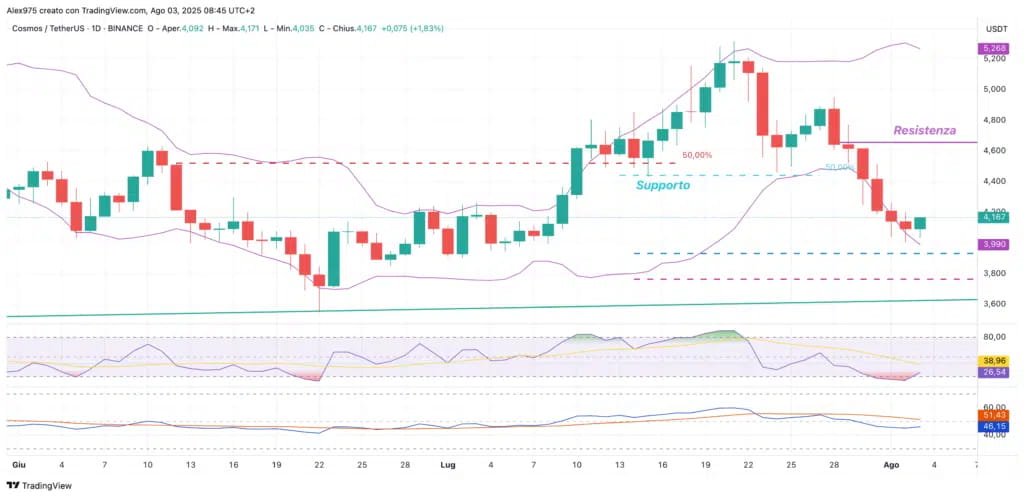
From this point, a Doji candle was formed, from which the bearish phase began. The drop reached the first support at $4.44 USDT, from where it attempted a reaction, but at the end of July it was broken downward.
Supports, rebounds, and resistance
Yesterday, the price of ATOM hit a low of $4.07 but did not reach the support of $3.92 USDT. The movement did not provide usable patterns, as the price remained within the lower Bollinger band.
At the time of writing, ATOM is up by +1.69%, but to signal a recovery it must surpass the first resistance, which lies in the area of $4.65. In terms of indicators, the fast RSI is turning and exiting the oversold zone, but we will need to wait for the daily candle close to have definitive confirmations.